 MCP Insights
 PRO Paradiser
 MCP MasterClass
  ParadiseFamilyVIP Crypto Signals💰
Candlestick Chart Basics
In short
A candlestick chart is a visual representation of price action over a specific period, showing the opening, closing, high, and low prices. Each candlestick provides insight into market sentiment by displaying price movements, allowing traders to identify potential trends and reversals. Understanding these patterns is a key component of technical analysis in crypto trading.
Did you know that understanding the candlestick chart might help you forecast the direction of the market?
The fact of the matter is that the global financial sector, which includes the cryptocurrency industry, can be quite unpredictable. When technical and fundamental analysis, as well as asset management technicalities are understood correctly, it is possible to have a better understanding of how the market operates.
The candlestick chart is one of the most potent technical tools available. We have put together this guide that will teach you how to read candlestick patterns so that you can put them to use in the trading market.
Despite the fact that Charles Dow modified candlestick charting in the late 1800s, the fundamental concepts of candlestick charting remains unchanged today. Price action is more significant than earnings, news, or any other basic concepts, according to both current and historical technical analysts who adhere to the methodology.
In other words, the price reflects all of the information that is now available, and this information is shown exactly in the candlestick.
Interested in learning more about Cryptocurrency Trading? Join MyCryptoParadise:
MyCryptoParadise has over 6 years of experience in providing cryptocurrency trading advice which could easily be lauded as among the best in the market today. The ParadiseTeam holds this status because we continue to offer some of the most intuitive technical analysis, educational content, current updates, and news reports in the industry that greatly benefit our customers by allowing them to take the edge over their competition.
MyCryptoParadise also provides insights via educational trading analysis on platforms such as TradingView, Youtube, Telegram and Facebook and Instagram.
MyCryptoParadise caters to traders of all levels of expertise, whether they are novices or seasoned professionals. Unlike other crypto channels on Telegram. With our ParadiseVIP Membership, you can gain access to a personal crypto expert to help you with the basics, teach you how to execute our trades, and give you insights about the risk and fund management techniques that we use.
Moreover, we also offer an introductory call with one of our experts once you join us before you start trading. Don’t believe us? check what our happy customers have to say.
Join us and become part of a thriving community of members who are taking their trading game to the next level.
1. My Binance Paradise – https://t.me/MCP_binance
2. My KuCoin Paradise – https://t.me/MCP_KuCoin
Use our discount BESTTRADERS20% to get an exclusive 20% discount on your premium membership today!
Now lets get back to understanding candlestick patterns…
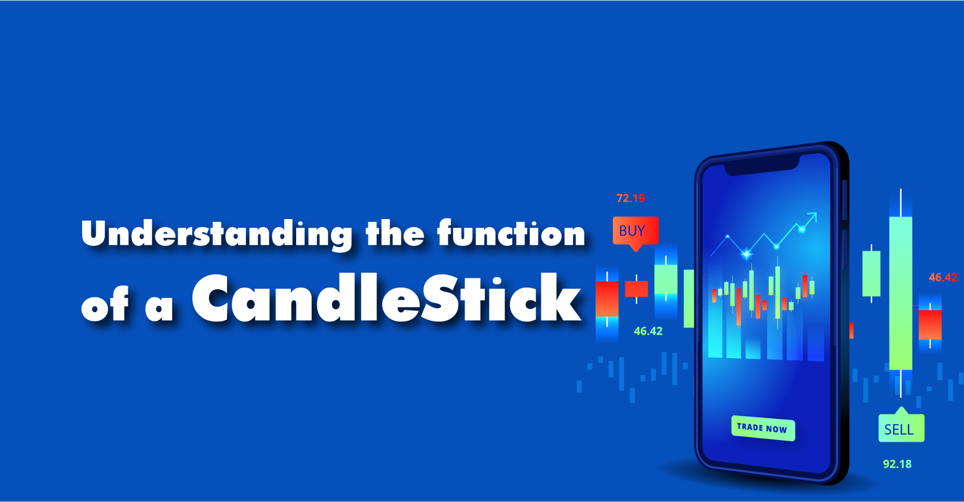
Understanding the function of a candlestick
A candlestick is a visual representation of the price activity of an asset over a specific timeframe. It is made up of four primary components: the open, close, high, and low prices of the asset.
The “open” of a candlestick reflects the price of an asset at the start of the trading period, whereas the “close” of a candlestick shows the price of an asset at the end of the trading period. The terms “high” and “low” refer to the highest and lowest prices that were attained during the same trading session, respectively.
Every candlestick displays the four primary components through the use of two physical characteristics.
- In the first place, the body of the candlestick is the wide middle of the candlestick, which represents the opening and closing of the candlestick during the observation time (most charts will allow you to set the range for the candlesticks)
- The close is represented by the green candlestick at the top of the body, and the open is represented by the red candlestick at the bottom of the body.
- The open, which forms the bottom of the green candlestick and the top of the red candlestick, is the polar opposite of the closed candlestick.
- The second characteristic of the candlestick, known as the ‘wick,’ represents the final two components of the candlestick: the high and low points. Wicks are simply depicted as thin lines that extend above and below the body of the character.
By employing charts with intra-day time frames, cryptocurrency traders are able to take advantage of the inherent volatility of the market and profit from it. Each candlestick signifies one, two, four, or twelve hours, depending on the time of day. For example, a longer-term trader will most likely prefer to look at candlesticks that represent a single day, week, or month.
When the current or closing price climbs above the beginning price, a candlestick is considered “bullish,” and the colour of the candlestick is often green.
When the current or closing price of the candlestick falls below the beginning price, the candlestick is said to be “bearish,” and the colour of the candlestick changes to red.
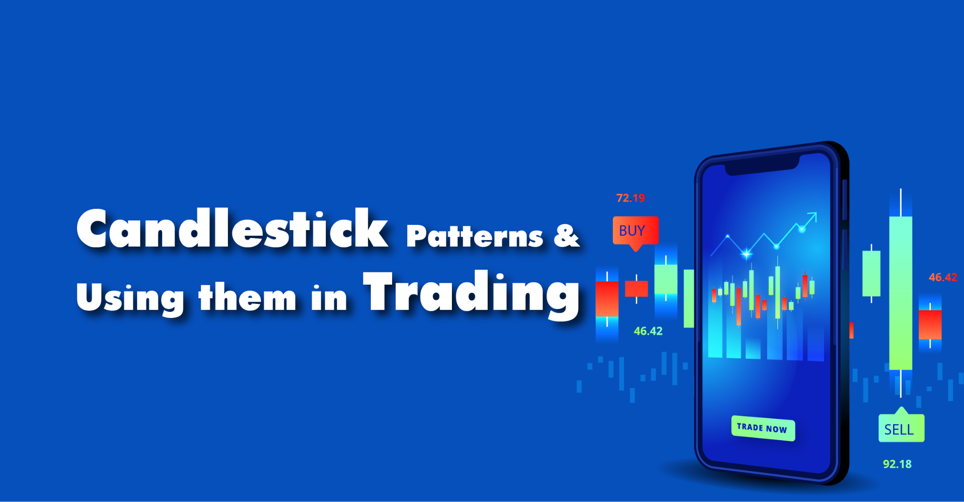
Candlestick Patterns & Using them in Trading
In the turbulent cryptocurrency market, a candlestick seldom maintains its shape for an extended period of time.
For example, if the 2-hour candlestick begins at $10 and then leaps to $13 an hour later, the candlestick’s form will have shifted dramatically since opening.
However, traders have discovered that the same candlestick shapes occur at the same stage of a price trend regardless of the instrument traded. Identifying such patterns may be extremely profitable since they provide insight into when a trend may reverse, persist, or reach a height of market hesitation.
The “doji,” “hammer,” and “shooting star” are three of the most effective candlestick patterns for spotting a probable trend change or measuring market mood.
The doji candlestick is an excellent illustration of what traders mean when they say a candlestick expresses human emotion or market mood.
When an asset’s price oscillates in both directions before ending around its initial price, the market is clearly undecided about the asset’s genuine value.
The traditional doji candle is characterised by equal-length wicks and an extremely thin, centrally positioned body. Additionally, there are various variants of doji that indicate trend exhaustion/reversal.
A hammer is a sign of a possible downtrend reversal and can be a significant profit generator for bulls.
Hammers occur when the price falls below the open only to subsequently recover and close above it. Such price movement indicates that sellers briefly seized control throughout the trading session but swiftly relinquished it and then some, resulting in a bullish finish to the candlestick.
hammer
Finally, and perhaps most importantly, the shooting star is the polar opposite of the hammer.
At the zenith of an uptrend, the shooting star happens when bulls surge to begin the trading period but gradually cede control to bears, who push prices to a close below the open.
It’s critical to remember that the longer the candlestick’s duration, the more significant its influence on the underlying trend.
For example, a hammer created in a one-hour candlestick will have little effect on a six-month downtrend, but a hammer formed in a one-week candlestick will have a considerably greater reversal effect.
What is different here
Most guides stop at the theory. The MyCryptoParadise team shares the live trades, and the reasoning behind each one, inside ParadiseFamilyVIP. Everything here is education, not financial advice.
Crypto trading involves substantial risk and is not suitable for everyone. Nothing here is financial advice; it is education only. Never risk more than you can afford to lose.


Join the discussion
No comments yet. Pro Paradiser members, share how you are reading this.