


Candlestick Patterns Explained
In short
A bullish hammer candlestick is a pattern that signals a potential reversal of a downtrend, typically appearing at the bottom of a price decline. It is characterized by a short body, often green or white, and a long lower wick, indicating that buyers overcame selling pressure to push prices higher after an initial drop.
A bullish hammer candlestick pattern describes a pattern which forms when there’s about to be a reversal of a downtrend. Traders look for this pattern at the bottom of the downtrend. The candlestick usually has a short body and a characteristically long wick or tail. The body of the candlestick is normally green, and in some cases, white. This indicates a bullish reversal. When this pattern forms, it indicates that sellers have propelled prices down too far, and buyers have stepped in to push prices back up.
How is a Bullish Hammer Candlestick Formed?
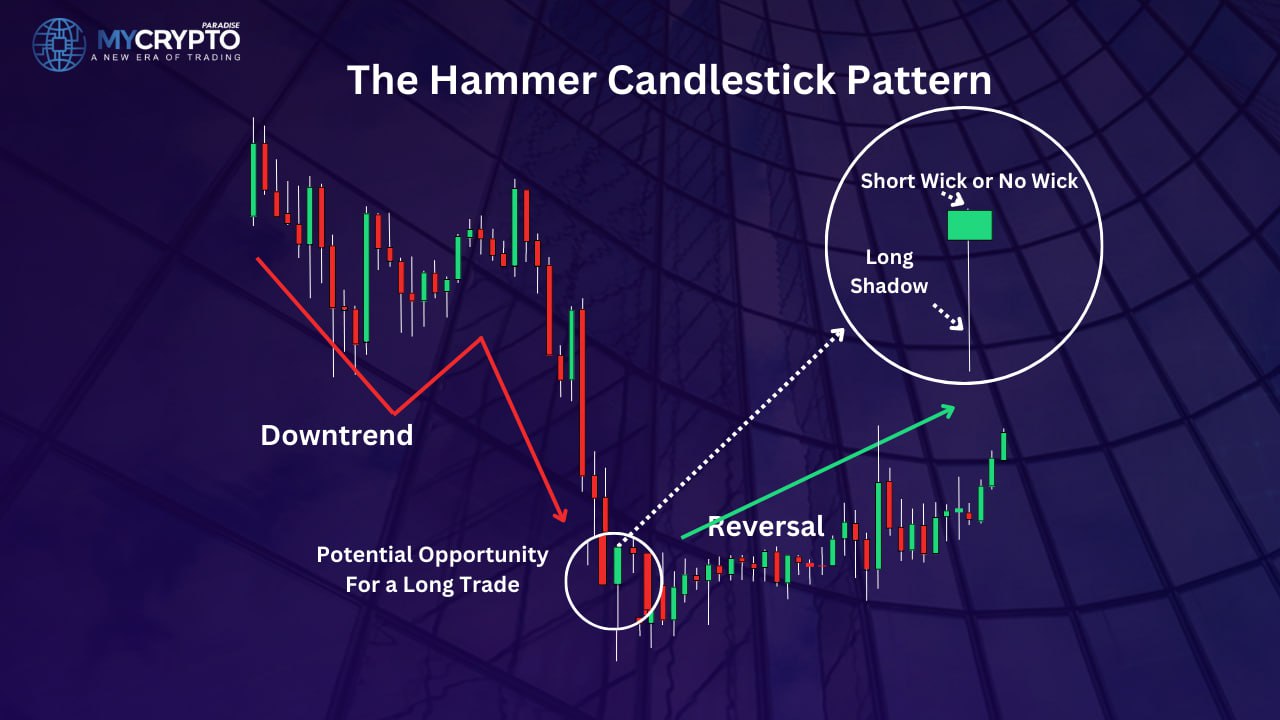
A bullish hammer candlestick is formed when prices open near the low of the day, and then rally to close near the high of the day. The result is a short body candlestick. The long lower wick indicates that prices fell significantly during the day, but buyers stepped in to push prices back up. The long lower wick is a key feature of the bullish hammer pattern, as it shows that there was strong buying pressure at lower price levels
Why is the Bullish Hammer Candlestick Important for Traders?
The bullish hammer candlestick is important for traders because it’s a strong signal of a potential reversal in the trend. When this pattern appears, it suggests that buyers have become more active, and that the market may be shifting from a downtrend to an uptrend. This can be an opportunity for traders to buy into the market at a lower price, with the expectation of profiting from a future uptrend.
How to Use the Bullish Hammer Candlestick in Trading
To use the bullish hammer candlestick in trading, traders should look for this pattern at the bottom of a downtrend. Once the pattern appears, traders should wait for confirmation of a bullish reversal before entering a long position. Confirmation can come in the form of a price close above the high of the hammer candlestick or a break of a resistance level. Additionally, traders can use moving averages to confirm the bullish reversal.
If the hammer candlestick appears near a moving average, and prices subsequently move above the moving average, this can be a strong confirmation of a bullish reversal. This pattern can be a signal that the selling pressure has exhausted, and the buyers are starting to enter the market. If the following day’s candle confirms the bullish hammer by opening higher and continuing to move up, it can indicate that a trend reversal may be underway.

It can also be a signal to enter a long position, with a stop loss set below the low of the bullish hammer candlestick. Profitable traders usually use this pattern together with other indicators. This confirms a bullish reversal with more accuracy. However, traders should be aware that the bullish hammer pattern is not foolproof, and that other candlestick patterns can also indicate a potential shift in the trend.
Bullish Hammer Can Sometimes Give False Signals
The hammer candlestick doesn’t always give a bullish signal. Patience and perseverance are needed to understand false setups signaled by a hammer.
In some cases, a hammer can appear, but won’t result in a bullish reversal. Additionally, traders should be aware that the bullish hammer pattern is not the only signal of a potential reversal in the trend.
The Difference Between a Hammer Candlestick and a Doji
Always remember the hammer candlestick and doji are different candlesticks. While both candlestick patterns signify indecision in the market, the hammer pattern indicates that buyers have gained control after a period of selling pressure.
One key difference between a hammer and a doji is the shape of the candlestick. A hammer candlestick has a long lower shadow, indicating that the price of the asset has fallen significantly before rebounding.
Another notable difference between the hammer and doji candlestick patterns is the sentiment they convey. A hammer signals a potential reversal in a downtrend, indicating that buyers are starting to take control. A doji, on the other hand, can signal indecision in the market, and it may not necessarily indicate a trend reversal.
Conclusion
The hammer candlestick is a useful tool for both new and experienced traders. They use it to identify potential reversals in the market trends. When this pattern appears, it suggests that buyers have become more active, and that the market may be shifting from a downtrend to an uptrend.
Crypto trading involves substantial risk and is not suitable for everyone. Nothing here is financial advice; it is education only. Never risk more than you can afford to lose.


Join the discussion
No comments yet. Pro Paradiser members, share how you are reading this.