



Chart Patterns Explained
In short
A triple bottom is a bullish reversal pattern characterized by three near-equal lows forming a flat support level after a downtrend, with two rallies between them. The pattern confirms when the price breaks above the resistance line connecting the highs, ideally on rising volume, signaling a potential trend reversal from a downward to an upward trend.
Triple bottom pattern is a technical analysis strategy used in various financial markets, including cryptocurrency trading. It involves identifying patterns on price charts that suggest a potential reversal in the downward trend of an asset. The basic concept of triple bottom trading remains the same. However, there are some advanced methods and techniques that traders can employ to enhance their trading strategies in the crypto market.
How to Identify Triple Bottom Pattern
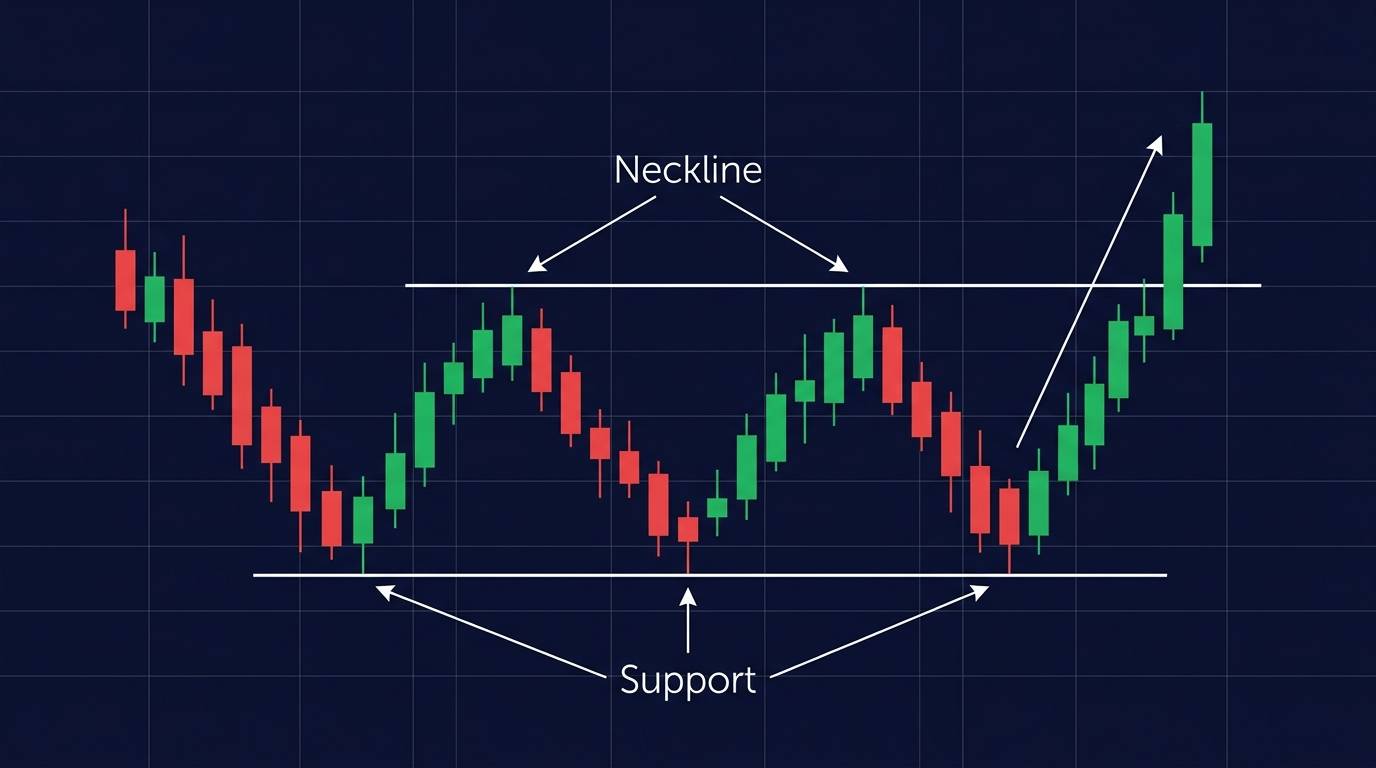
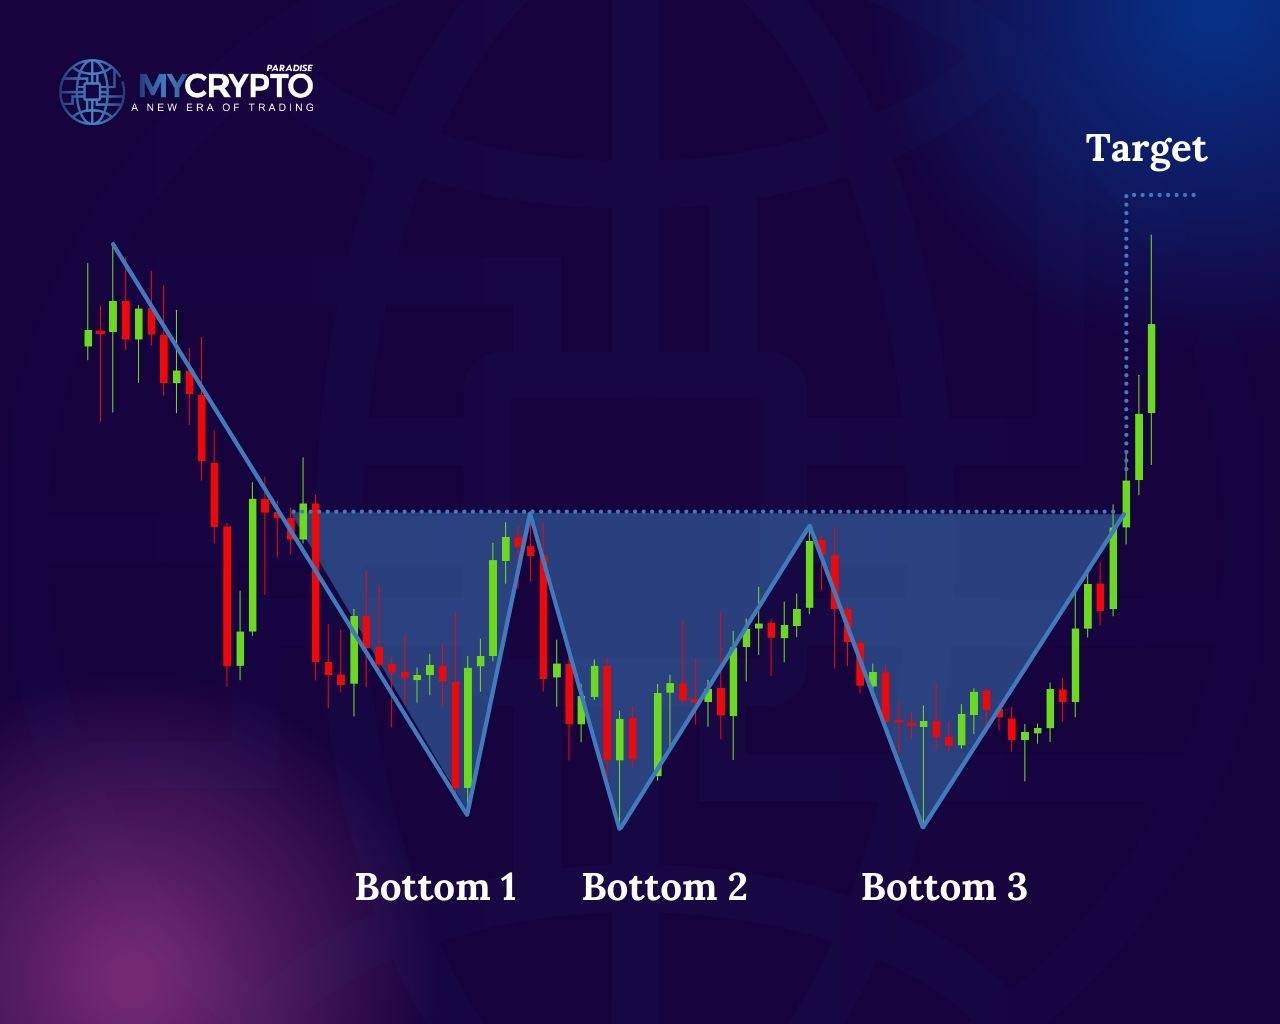
The triple bottom pattern is a bullish reversal pattern that forms on a price chart. It signals a potential trend reversal from a downward trend to an upward trend. It consists of three distinct lows that are relatively equal in price and form a horizontal or near-horizontal support level. Here’s a description of how the triple bottom pattern typically looks:
1. Downtrend: Before the formation of the triple bottom pattern, there is a clear and established downtrend in the price chart. This downtrend is characterized by a series of lower lows and lower highs, indicating a bearish trend.
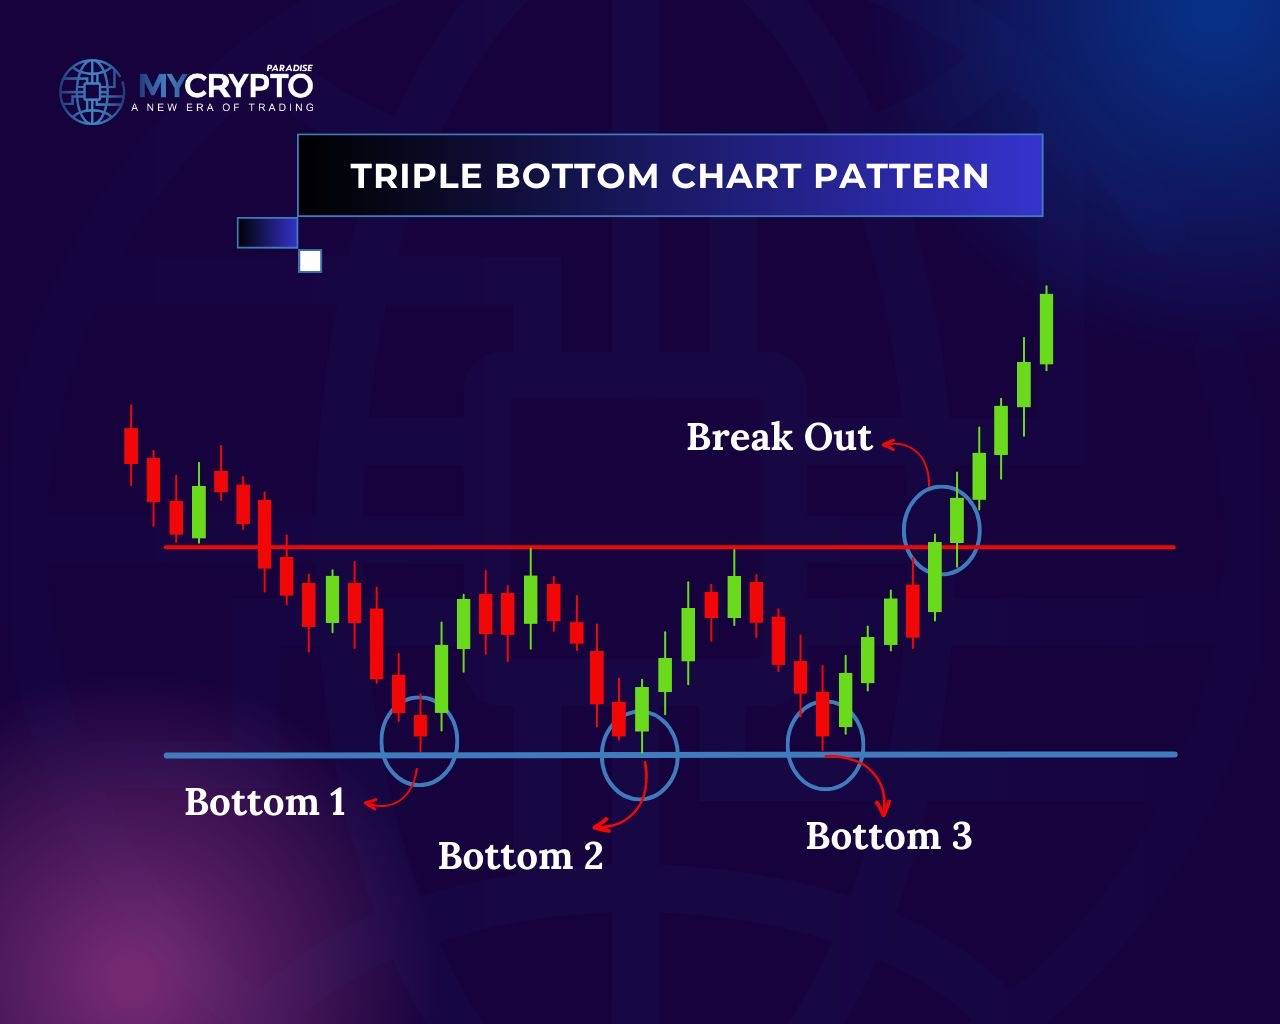
2. First Low (Left Bottom): The first low of the pattern occurs after a downward move in price. It represents a support level where buying pressure temporarily halts the decline. After this low, there is typically a temporary upward movement in price.
3. First Rally: Following the first low, there is a price rally or a retracement from the low. The rally may not reach the previous high but should show some upward momentum.
4. Second Low (Middle Bottom): After the first rally, the price declines again, forming a second low. This low should be relatively equal in price to the first low and form a support level. That shows buyers are stepping in to prevent further declines.
5. Second Rally: Following the second low, there is another price rally or retracement. Similar to the first rally, the second rally may not reach the previous high but should exhibit upward momentum.
6. Third Low (Right Bottom): After the second rally, the price declines once more to form the third and final low. This low should be relatively equal in price to the first two lows, completing the triple bottom pattern. It confirms the strength of the support level and suggests that buyers are actively entering the market.
7. Resistance Level: To identify the triple bottom pattern, draw a trendline connecting the highs between the three lows. This trendline acts as a resistance level and represents the price level that needs to be broken for the pattern to be confirmed.
8. Breakout: The pattern is confirmed when the price breaks out above the resistance level formed by the trendline connecting the highs. The breakout should be accompanied by increased volume and sustained upward momentum, indicating a potential trend reversal.
Is the Triple Bottom Pattern Bullish or Bearish?
The triple bottom is a bullish pattern. Where it forms on the chart still changes how much weight it deserves.
Bullish Reversal Pattern
Most often, the triple bottom appears after a downtrend. Sellers push price to the same support three times, and buyers absorb the selling each time. A close above resistance on rising volume is the sign that sellers are losing control.
Inside an Uptrend
Less often, the same three-low structure forms during a pullback inside an uptrend. Some traders read it as a base before the trend resumes. The classic definition still treats the triple bottom as a reversal pattern, so the breakout above resistance remains the trigger.
Triple Bottom Versus Triple Top
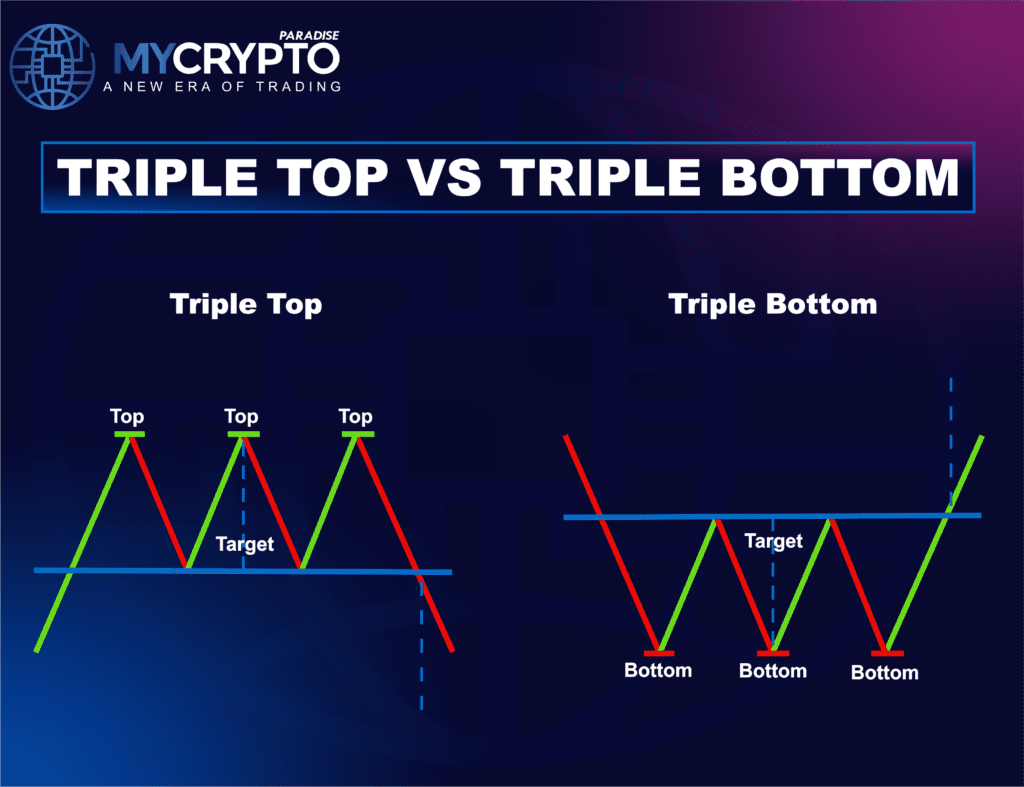
The triple top is the mirror image. It forms after an uptrend, with three failed attempts to break the same resistance. It confirms when price closes below support on heavy volume, which makes it a bearish reversal signal. Read more in our triple top pattern guide.
Advanced Methods to Trade Triple Bottom Pattern
1. Multiple Time Frame Analysis: Crypto traders can run a triple bottom analysis on multiple time frames. This gives a better read of the overall trend and potential reversals. By analyzing shorter-term and longer-term charts simultaneously, traders can identify more reliable triple bottom patterns and make more informed trading decisions.
2. Volume Analysis: Incorporating volume analysis into triple bottom trading can provide additional insights into the strength of the potential reversal. Volume often fades while the three lows form, then expands on the breakout. A clear rise in volume on the breakout adds credibility to the reversal. Weak breakout volume may suggest a lack of interest and weakens the reliability of the pattern.
3. Confirmation Indicators: Traders often use additional technical indicators to confirm the validity of the triple bottom pattern. Commonly employed indicators include the Moving Average Convergence Divergence (MACD), Relative Strength Index (RSI), and Stochastic Oscillator. These indicators help traders confirm the emergence of bullish momentum and validate the potential reversal indicated by the triple bottom pattern.
4. Breakout Confirmation: Rather than buying the first move above resistance, advanced traders use breakout confirmation techniques. They wait for a decisive close above the resistance level, accompanied by a significant increase in volume. This approach helps filter out false breakouts and improves the quality of the entry.
5. Risk Management: Implementing proper risk management techniques is crucial in any crypto trading strategy, including triple bottom trading. Advanced traders use techniques such as setting stop-loss orders to limit potential losses and trailing stops to protect profits as the trade progresses. They also consider position sizing, ensuring that the risk exposure on each trade is within their predetermined risk tolerance.
6. Fundamental Analysis: While triple bottom trading primarily focuses on technical analysis, advanced traders may incorporate fundamental analysis into their decision-making process. They consider factors such as market sentiment, news events, regulatory developments, and project fundamentals. These help them judge overall market conditions and the potential impact on the trade.
7. Backtesting and Optimization: Advanced traders understand the importance of backtesting their trading strategies before implementing them in the live market. They use historical price data to test the effectiveness of triple bottom trading methods and optimize their strategies based on past performance. This iterative process helps refine the trading approach and adapt it to different market conditions.
How to Determine Entry, Stop Loss, and Take Profit When Trading Triple Bottom Pattern
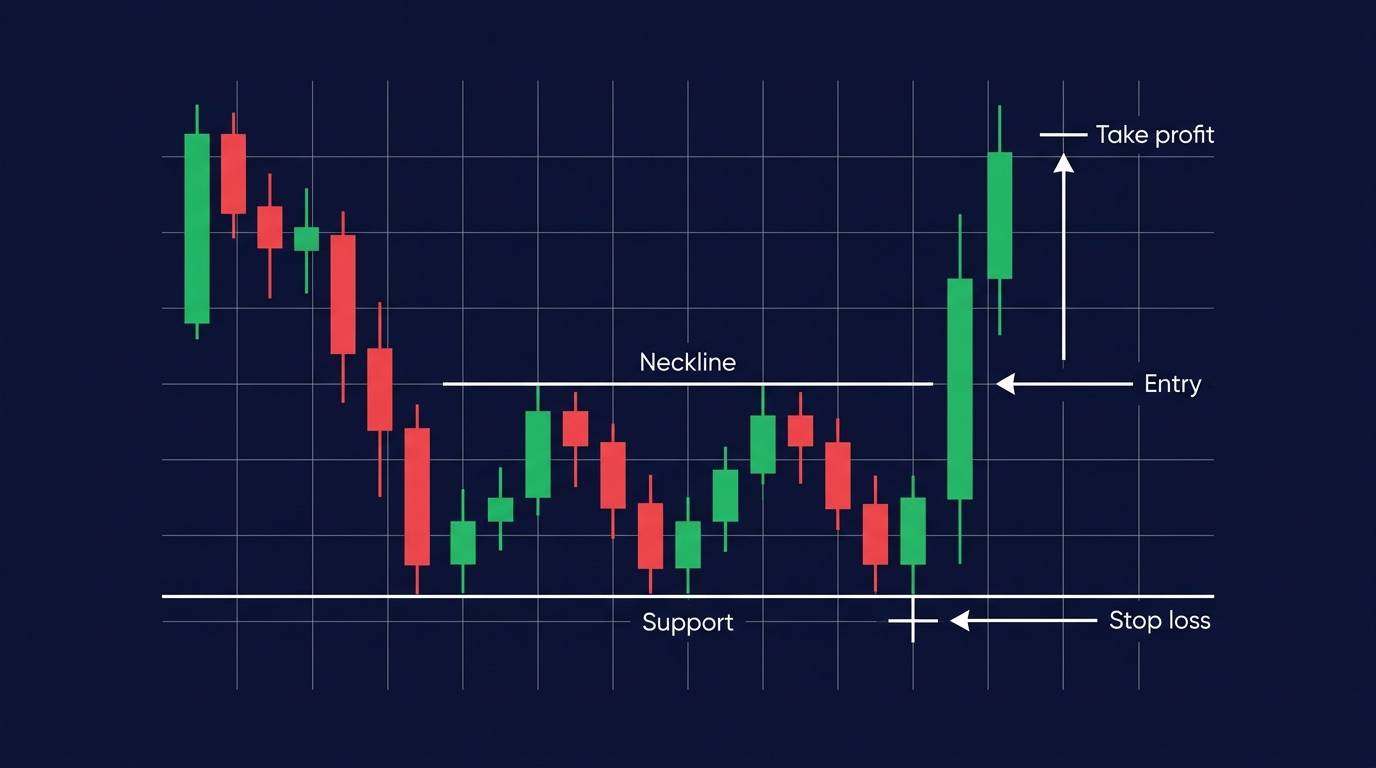
Setting the entry, stop-loss, and take-profit levels for a trade based on the triple bottom pattern requires careful consideration of risk management and market conditions. Here’s a general guideline on how you can approach setting these levels:
Entry Level
Conservative Approach: Enter the trade once the price breaks above the resistance level formed by the trendline connecting the highs between the three lows. This provides confirmation that the pattern is valid and increases the likelihood of a successful reversal.
Aggressive Approach: Some traders prefer to enter the trade earlier, anticipating the pattern’s completion. They may enter after the formation of the second low or during the second rally. However, this approach carries higher risk, as the pattern may not fully materialize.
Retest Approach: Patient traders wait for the breakout, then for price to return to the old resistance. If that level now holds as support, they enter on the bounce. The retest does not always come, but when it does, it usually allows a tighter stop.
Stop Loss
Place your stop-loss order below the lowest point of the triple bottom pattern. This level acts as support. If the price breaks below it, the pattern has likely failed and the downward trend may continue.
Consider adding a buffer to your stop loss to account for potential price fluctuations and avoid premature stop-outs. The size of the buffer will depend on your risk tolerance and the volatility of the cryptocurrency being traded.
Take Profit
The target for your take-profit level can be determined using various methods:
- Measuring the Pattern: Measure the distance from the resistance level to the lows of the pattern and project that distance upwards from the breakout point. This provides a potential target for the price move.
- Previous Resistance Levels: Identify significant previous resistance levels on the chart. These levels can act as potential take-profit targets as the price may encounter resistance again.
- Trailing Stop: Instead of setting a fixed take-profit level, you can use a trailing stop order to lock in profits as the price continues to move in your favor. Adjust the trailing stop level based on your risk tolerance and desired profit capture.
The exact levels for entry, stop loss, and take profit will vary with market conditions, volatility, and your individual trading strategy. Apply your own risk management rules and adapt these levels to your trading style and the coin you are trading. Monitor the trade regularly and adjust as market conditions change.
Triple Bottom Versus Similar Chart Patterns
Several bullish reversal patterns look alike at first glance. What sets the triple bottom apart is one support level defended three times.
Triple Bottom Versus Double Bottom
A double bottom tests support twice before the breakout. It can resolve quickly, so the setup is easy to miss. A triple bottom adds a third test, which gives more evidence that buyers are defending the level.
Descending Channel Versus Triple Bottom
In a descending channel, price drifts lower between two parallel sloping lines. It can break out higher, but there is no single level where buyers hold the line. The flat support of a triple bottom makes the entry, stop and target easier to define.
Triple Bottom Versus Falling Wedge
In a falling wedge, both trendlines slope down and converge. It shows compression rather than repeated defence of one level. Falling wedges also tend to break higher, but the triple bottom marks a clearer demand zone.
How Reliable Is the Triple Bottom Pattern?
No chart pattern is reliable on its own. How well a triple bottom holds up depends on market conditions, the quality of the pattern, and how well the trade is executed. The triple bottom is a bullish reversal pattern, but it does not guarantee a profitable trade.
Here are the key factors that make a setup stronger or weaker:
1. Market Conditions: A supportive broader market, or a clear positive catalyst, gives the pattern more room to work. If the broader market is bearish or under strong selling pressure, the pattern’s effectiveness may be diminished.
2. Pattern Quality: A high-quality triple bottom has clear, well-defined lows that are relatively equal in price. Volume usually fades while the pattern forms. The cleaner and more symmetrical the pattern, the more weight the signal deserves.
3. Confirmation Signals: Look for confirmation before acting. These may include increased volume during the breakout, bullish candlestick patterns, or momentum indicators turning up.
4. Trader’s Execution: The trader’s ability to execute the plan matters as much as the pattern. This includes correctly identifying the pattern, entering at the right time, and managing the trade according to a written plan. Experience, skill, and discipline all shape the result.
Common Mistakes to Avoid With the Triple Bottom Pattern
Entering Before the Breakout
Price hovering just under resistance can make the breakout feel certain. It is not. Without a solid close above resistance, the pattern is still unconfirmed.
Ignoring Breakout Strength and Momentum
Not every breakout is real. When price barely crawls through resistance on thin volume, it often rolls back over. A genuine move usually shows strong candles and a clear rise in volume.
Forcing the Pattern on Charts
A few touches of the same area in a choppy market do not make a triple bottom. The pattern needs a prior downtrend and three clear lows near the same price.
Ignoring the Higher Timeframe Context
A triple bottom on a small chart can form while the higher timeframe trend is still falling hard. That setup deserves less weight. The pattern works best when the larger trend is already losing downside momentum.
Poor Risk Management
Stops placed without a reason, or positions sized too large, can turn one failed pattern into a large loss. Keep the stop below the lowest of the three lows and size the position to your own risk rules.
Overlooking Market Conditions and News
Major news, sharp volatility, or a sudden shift in sentiment can break a clean setup. Check what is happening outside the chart before committing.
Conclusion
A trading pattern does not guarantee a profitable result. Trading involves real risk, and outcomes vary with market conditions and individual skill. Thorough analysis, several confirming tools, and sound risk management are what give the triple bottom its value as a signal.
The ParadiseTeam trades these reversal setups live inside ParadiseFamilyVIP, where every entry, exit and position size is shared. Membership is limited, and there is a waiting list when a group is full.
Our service is premium and geared toward traders with ample capital. If you’re still building your trading funds, we recommend starting with our FREE Telegram channels to build your skills and knowledge.
We trade on all major exchanges, including the vetted exchanges below, where we’ve secured up to 35% off trading fees and deposit bonuses for members. These exchanges have been thoroughly tested for security and legitimacy, and we trust them with our own money. In ParadiseFamilyVIP, we base our signals on the best liquidity and coins available on these exchanges. We also provide you with free access to these special links:
MEXC: https://www.mexc.com/campaigns/MyCryptoParadise0820
BINGX: https://bingx.com/invite/VY6MB8BAX/
KCEX: https://www.kcex.com/register?inviteCode=PARADISEFAMILYVIP
BITUNIX: https://www.bitunix.com/register?vipCode=ParadiseFamilyVIP
Triple Bottom Pattern FAQ
What is a triple bottom pattern?
It is a bullish reversal pattern that forms after a downtrend, made of three roughly equal lows resting on a horizontal support level with two rallies between them. It signals that sellers are losing control and a move higher may follow once price breaks resistance.
Is a triple bottom bullish or bearish?
The triple bottom is bullish. It usually forms after a downtrend and points to a possible reversal once price closes above resistance. The triple top is its bearish mirror image.
How is a triple bottom confirmed?
The pattern is confirmed when price closes above the resistance trendline drawn across the highs between the lows. A valid breakout is usually backed by increased volume and sustained upward momentum, which helps filter out false breaks.
Where do you set entry, stop loss, and take profit?
A conservative entry is on the confirmed breakout above resistance, while aggressive traders may enter near the second or third low. Place the stop below the lowest of the three bottoms, and set the target by projecting the pattern's height up from the breakout point.
How reliable is the triple bottom pattern?
Reliability depends on market conditions, pattern quality, and execution, and it never guarantees a profitable trade. Traders improve the odds with volume analysis, confirmation indicators like RSI or MACD, multiple time frame analysis, and disciplined risk management.
Crypto trading involves substantial risk of loss. This article is educational and is not financial advice. Past performance does not guarantee future results. Always do your own research.
What is different here
Most guides stop at the theory. The ParadiseTeam shares the live trades, and the reasoning behind each one, inside ParadiseFamilyVIP. Everything here is education, not financial advice.
Crypto trading involves substantial risk and is not suitable for everyone. Nothing here is financial advice; it is education only. Never risk more than you can afford to lose.













Join the discussion 1
Wow helpful article! Thanks for share