



In short
A bearish divergence happens when price makes a higher high while a momentum indicator such as RSI or MACD makes a lower high. It warns that the buying pressure behind the rally is fading. Ranked by strength, Class A is the classic version, where price makes a clear higher high and the indicator makes a clear lower high. Class B is the medium version, where price stalls at an equal high. Class C is the weakest, where price makes a higher high but the indicator only matches its previous high. Hidden bearish divergence sits outside that ladder, because it points to trend continuation rather than a reversal.
Price and momentum usually rise together. When they stop agreeing, the disagreement itself is the information, and a bearish divergence is the clearest version of that disagreement.
This guide ranks the bearish variants from strongest to weakest. It shows how each one looks on RSI, MACD and the Stochastic Oscillator. Then it sets out how to trade them with a defined stop and target.
What is a bearish divergence?
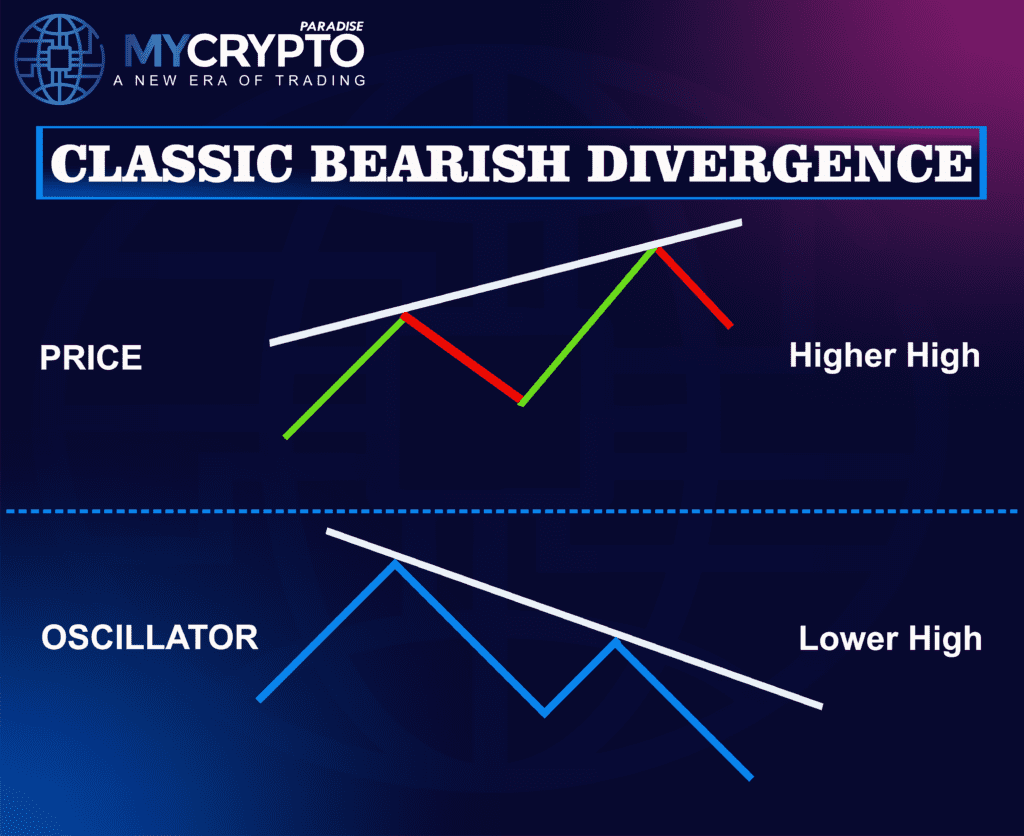
A bearish divergence is a mismatch between price and momentum at two swing highs. Price prints a higher high, but the momentum indicator prints a lower high. That gap says the second push cost the buyers more effort for less result, which often precedes a downward reversal.
Read every divergence at the swing highs, never at the candles in between. You need two comparable peaks in price and the two matching peaks on the indicator. If you cannot point at both pairs, there is no divergence to trade.
What is different here
Most guides stop at the theory. The ParadiseTeam shares the live trades, and the reasoning behind each one, inside ParadiseFamilyVIP. Everything here is education, not financial advice.
How are bearish divergences ranked by strength?
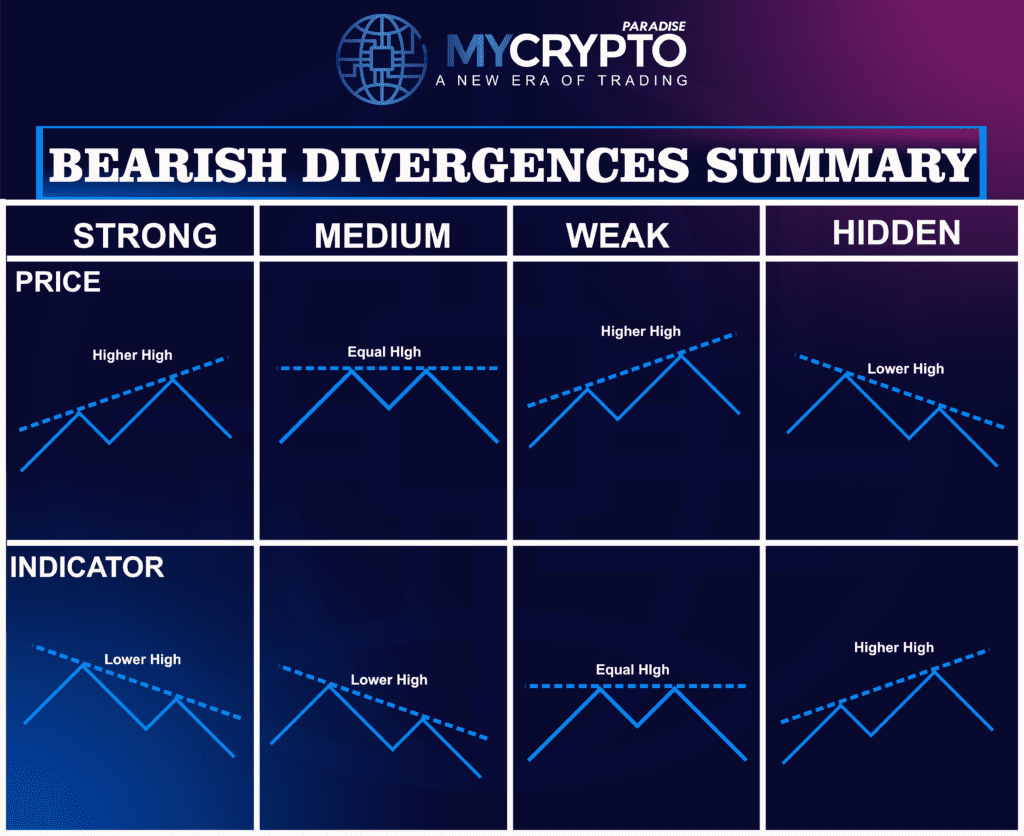
Bearish divergences are ranked by how wide the gap between price and momentum is. The wider and clearer the disagreement, the stronger the warning. The summary chart above sorts them into three classes, plus hidden divergence as a separate case.
- Class A, strong: price higher high, indicator lower high.
- Class B, medium: price equal high, indicator lower high.
- Class C, weak: price higher high, indicator equal high.
- Hidden: price lower high, indicator higher high, which reads as continuation.
Treat the class as a position sizing input rather than a yes or no switch. A Class A signal on a daily chart deserves more attention than a Class C signal on a five minute chart. Neither is a reason to trade without confirmation.
Class A: classic bearish divergence
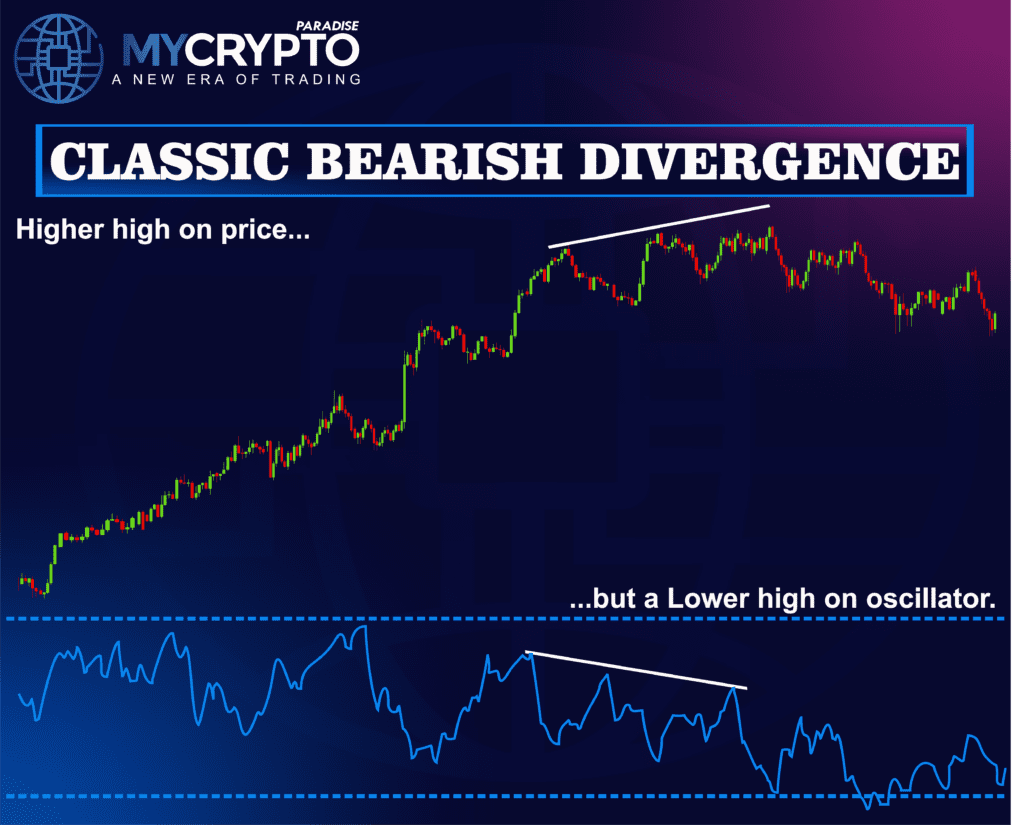
Classic bearish divergence is the strongest of the three. Price makes a clearly higher high, and the indicator makes a clearly lower high at the same two peaks. Both legs are unambiguous, which is exactly what makes this version the most reliable of the family.
How do you spot classic bearish divergence?
Find the two most recent swing highs in price, then look at the same two moments on your indicator. If price is higher at the second peak and the indicator is lower, you have a classic bearish divergence. The steps are the same whichever momentum tool you use.
- Mark two clear swing highs in price.
- Check the same two peaks on the RSI, MACD or Stochastic.
- Confirm the second indicator peak is lower.
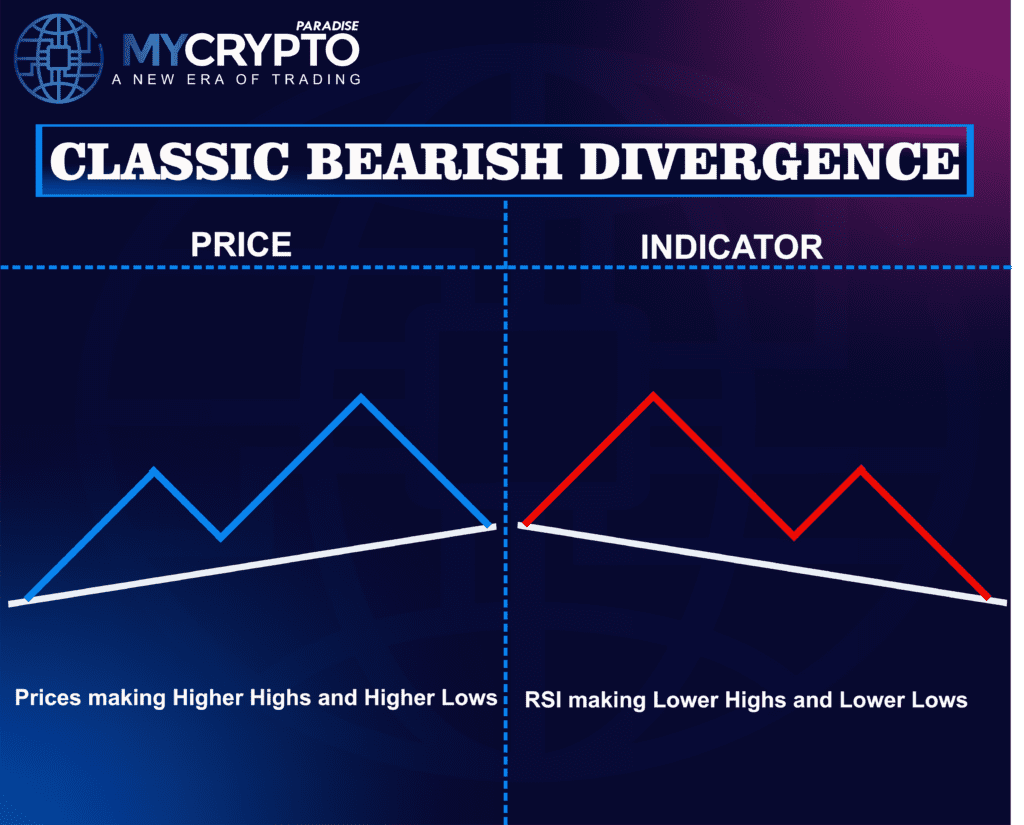
The three indicators differ in what they measure, not in how you read the divergence. The MACD compares two moving averages, so its lower high often shows up first in the histogram. The Stochastic Oscillator compares the close to its recent range, which makes it quick to flatten near a top.
What confirms a classic bearish divergence?
Confirmation is a momentum event that follows the divergence, not the divergence itself. The usual triggers are simple. A MACD line crosses below its signal line, an RSI rolls over and loses 50, or a Stochastic crosses down from its upper band. A break of the most recent swing low in price is the strictest confirmation of the group.
Class B: exaggerated bearish divergence
Exaggerated bearish divergence is the medium strength version. Price stalls at an equal high, usually as a double top, while the indicator still prints a lower high. Buyers reached the same level twice with visibly less momentum behind the second attempt.
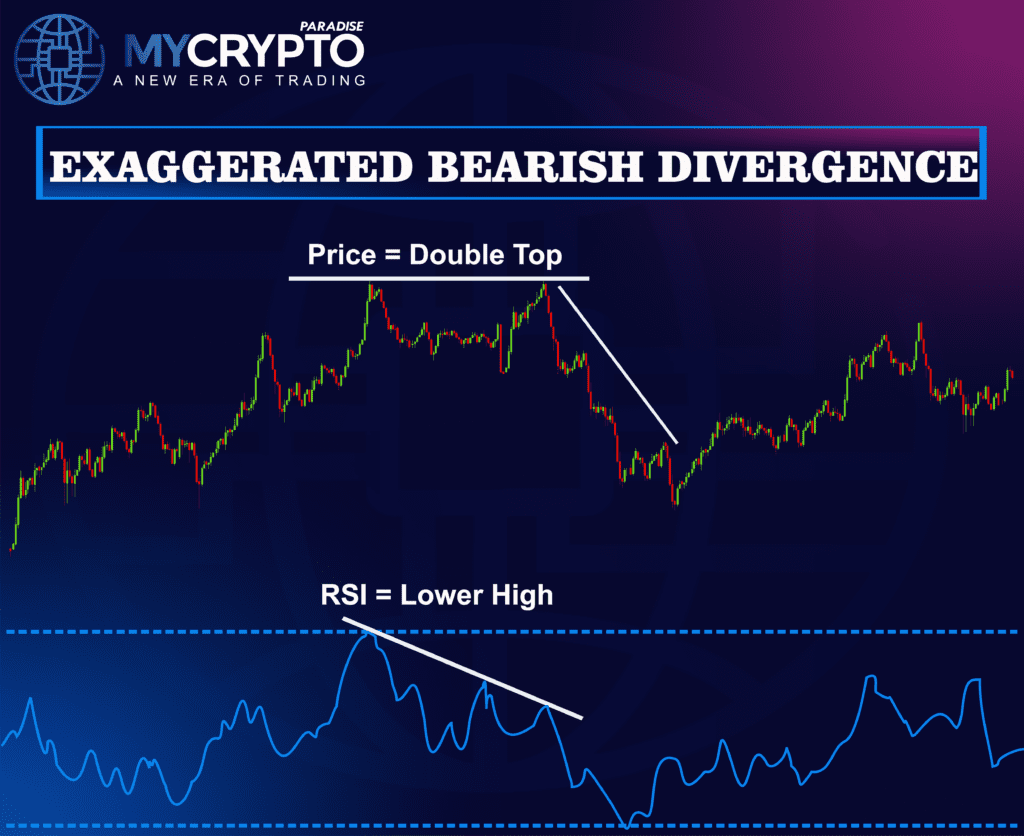
It ranks below Class A because price never actually made a new high. The rally simply stopped, so the signal describes a stall rather than a failure. Most traders wait for the level between the two tops to break before treating it as a reversal.
Class C: the weakest bearish divergence
Class C is the weakest of the three. Price makes a higher high, but the indicator only matches its previous peak instead of falling below it. Momentum has flattened rather than turned down, which is a milder warning than either stronger class.
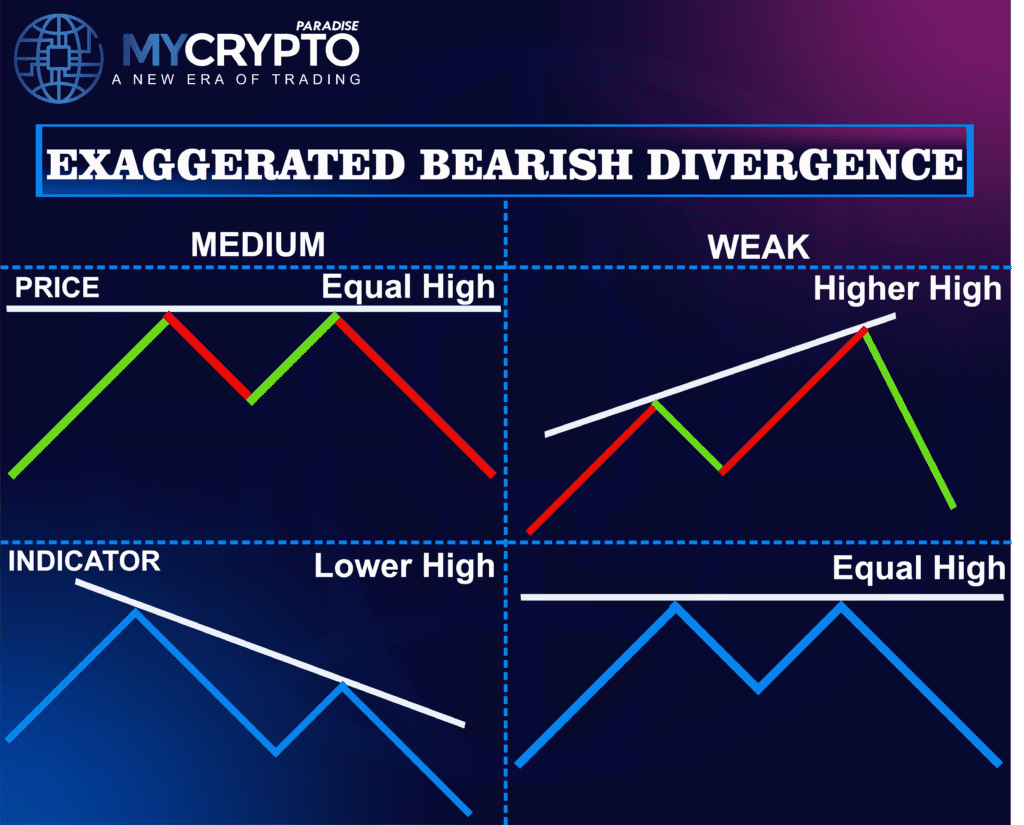
Use Class C as context rather than a trade trigger. It is a reasonable reason to tighten a stop on an existing long position or to stop adding to one. On its own, in a strong uptrend, it is thin evidence for a short.
Hidden bearish divergence points the other way
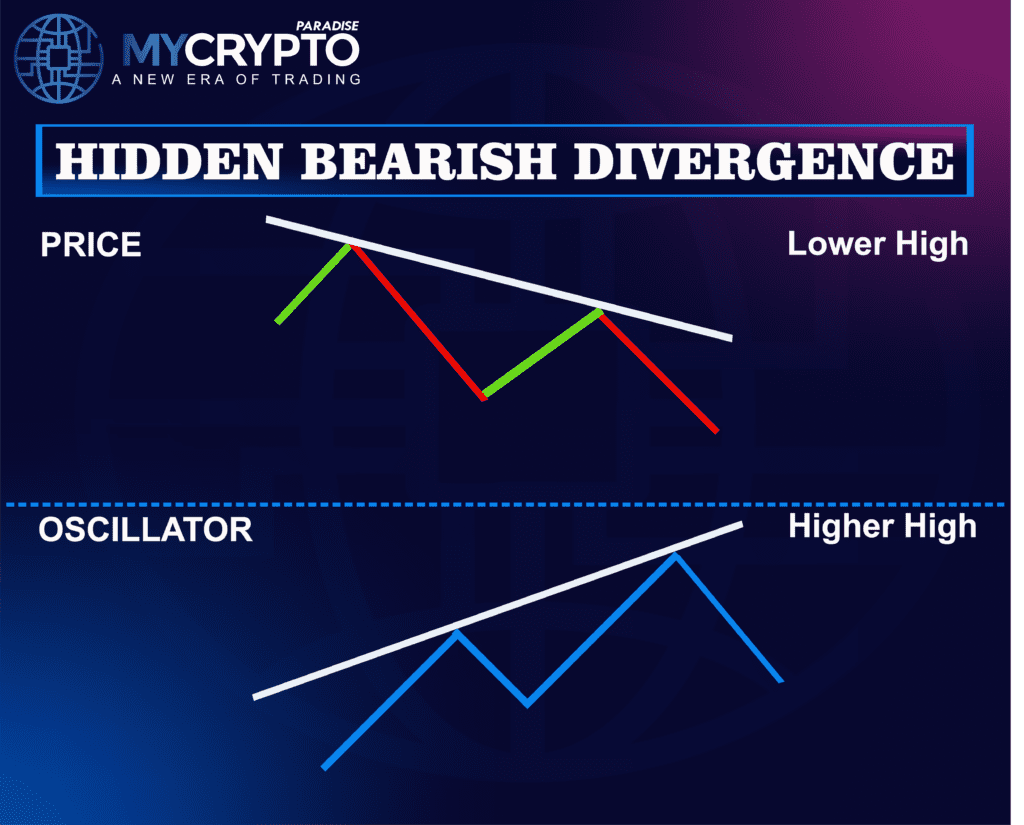
Hidden bearish divergence signals continuation, not reversal, so it sits outside the strength ladder. It appears in a downtrend when price makes a lower high while the indicator makes a higher high. The bounce carried more momentum than price, and the larger downtrend usually resumes.
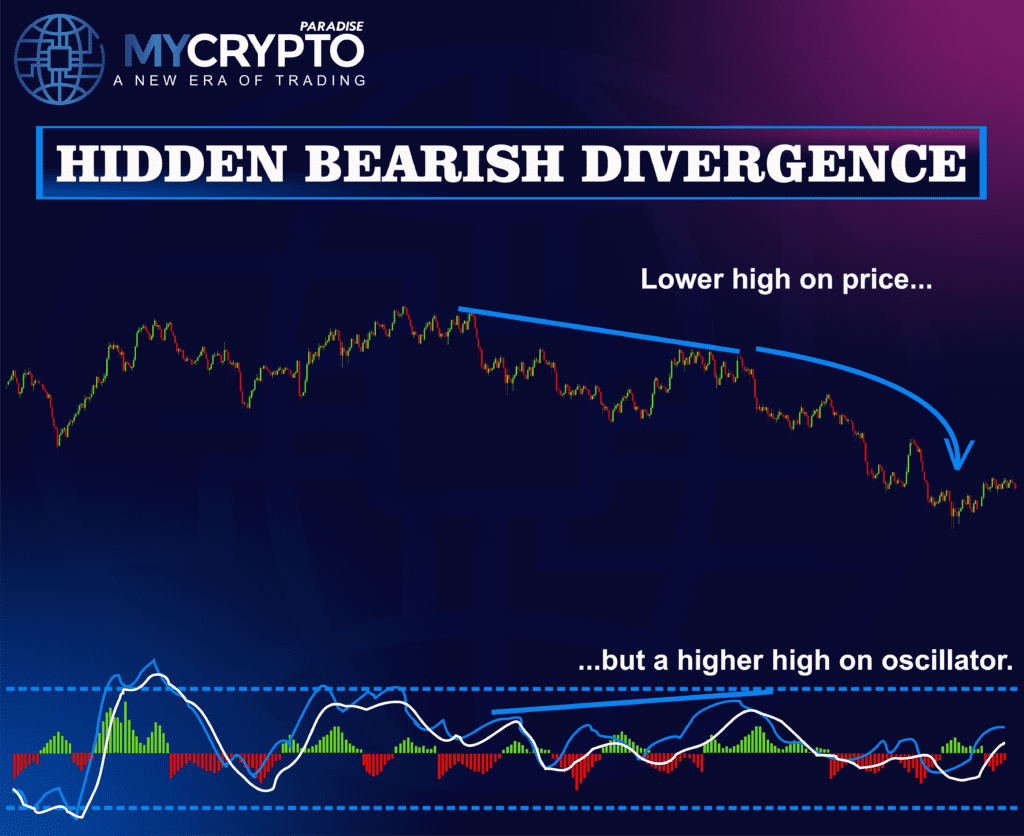
Because it is a continuation signal, it is used to rejoin an existing downtrend rather than to call a top. The full mechanics for both directions are covered in our hidden bullish and bearish divergence guide.
Extended and complex divergence: when the signal repeats
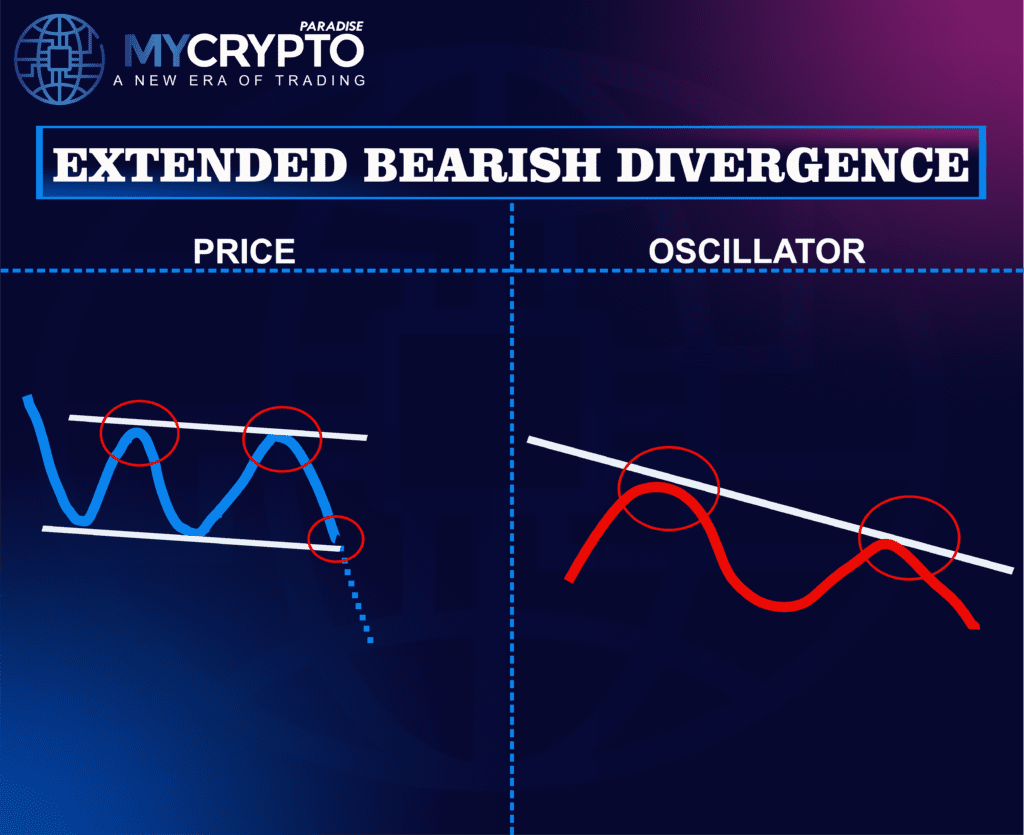
Sometimes the same disagreement repeats across several peaks instead of appearing once. Extended divergence draws out over three or more highs, often inside a rising wedge. The usual trigger is the break of that pattern rather than a single indicator cross.
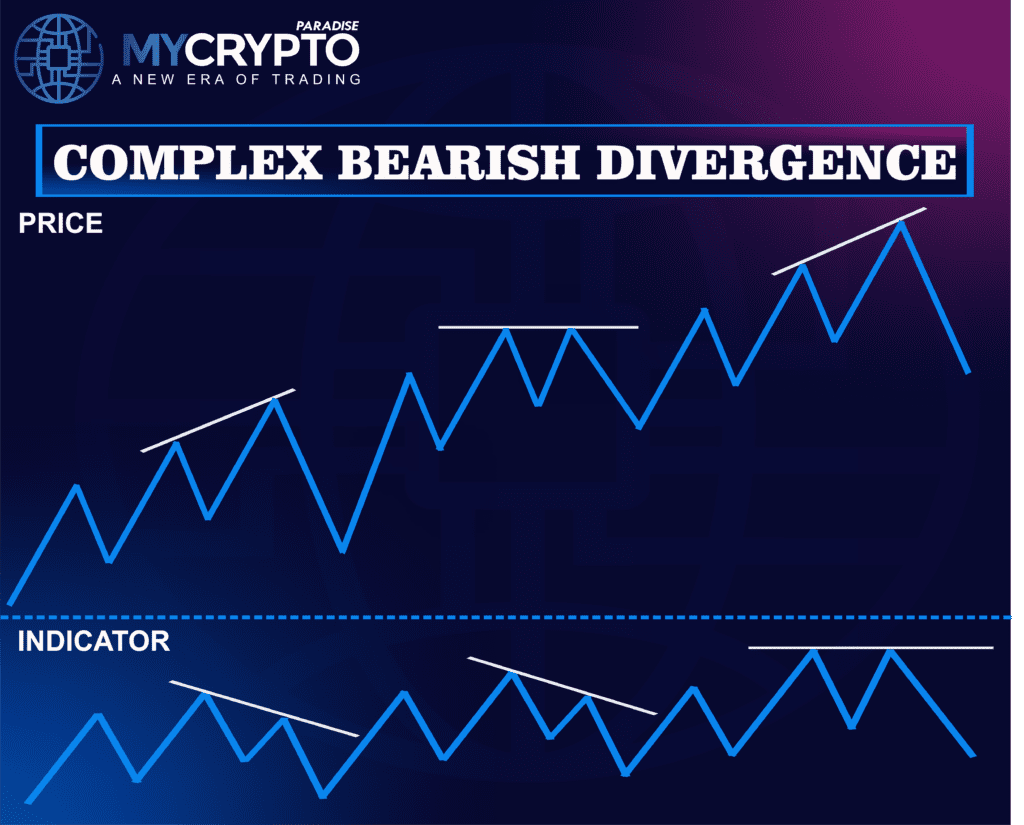
Complex divergence stacks several separate divergences through one long trend. Weigh it by the strongest class inside it, then expect slower timing. A signal that took weeks to build rarely resolves in an afternoon, and the wider stop that follows means a smaller position.
How do you trade a bearish divergence?
Trade the confirmation, never the divergence alone. A divergence tells you momentum is fading, and fading momentum can persist for a long time in a strong trend. The sequence below is the one the ParadiseTeam applies to every class.
- Identify the class and the timeframe.
- Wait for the momentum trigger or the structure break.
- Enter the short, or reduce longs.
- Place the stop above the divergence high.
- Target the nearest meaningful support.
Your stop belongs above the highest point of the divergence, because that is the level which proves the signal wrong. Everything below it is noise you paid for with a wider stop.
How do you size a divergence trade?
Position size comes from two separate numbers, and confusing them is a common error. The chart decides the stop distance. Your own rules decide the percentage of the account you are willing to lose on one idea. Size is simply what makes those two agree.
A wider stop therefore means a smaller position, not a larger risk. Pair that with an honest risk to reward ratio and a stop loss you will actually respect. Our risk management guides cover the full framework.
Why do bearish divergences fail?
Bearish divergences fail most often because momentum can flatten while price keeps rising. In a strong uptrend an indicator can print lower highs for weeks without a reversal arriving. The divergence was real, and the trade was still wrong.
- Shorting the first sign of weakness inside a strong trend.
- Reading divergence on a timeframe too small to matter.
- Comparing peaks that are not genuine swing highs.
- Holding without a stop while the trend continues.
The bullish mirror of every pattern here works the same way in reverse, and is covered in our guide to bullish divergence in crypto trading. If you prefer to learn one indicator deeply first, start with spotting bearish divergence on the MACD.
Bearish Divergences FAQ
What is a bearish divergence?
A bearish divergence occurs when an asset's price makes a higher high while a momentum indicator such as RSI, MACD, or the Stochastic Oscillator makes a lower high. This mismatch shows that bullish momentum is fading and a downward reversal may be approaching.
Which bearish divergences are the strongest?
Class A is the strongest, where price makes a clear higher high and the indicator makes a clear lower high. Class B is medium strength, where price stalls at an equal high. Class C is the weakest, where price makes a higher high but the indicator only matches its previous high.
How do you confirm a bearish divergence?
Wait for a momentum event after the divergence forms. Confirmation usually comes from the MACD line crossing below its signal line, the RSI rolling over and losing 50, or the Stochastic crossing down. A break of the most recent swing low in price is the strictest confirmation.
Is hidden bearish divergence a reversal signal?
No. Hidden bearish divergence signals continuation of an existing downtrend. It forms when price makes a lower high while the indicator makes a higher high, and traders use it to rejoin a downtrend rather than to call a top.
Where do you place the stop on a bearish divergence trade?
The stop belongs above the highest point of the divergence, because that level proves the signal wrong. Stop distance comes from the chart, while the percentage of your account at risk comes from your own rules, and position size is what makes the two agree.
Crypto trading involves substantial risk and is not suitable for everyone. Nothing here is financial advice; it is education only. Never risk more than you can afford to lose.










Join the discussion
No comments yet. Members, share how you are reading this.