



Chart Patterns Explained
In short
A descending triangle is a bearish continuation pattern characterized by a flat support line and a downward-sloping resistance line connecting lower highs. It indicates increasing selling pressure and often results in a price breakdown below the support level. This pattern typically forms during a downtrend, signaling that sellers are in control. Traders usually enter on a close below support, place the stop above the last lower high, and target the triangle’s height projected down.
Introduction
Crypto traders read chart patterns to judge where price is likely to go next, and the bearish descending triangle is one of the clearest. This lesson shows how it forms and how to confirm the breakdown and the retest. It also covers when the pattern breaks upward instead, and how to plan the entry, stop and target.
What is a Descending Triangle Pattern?
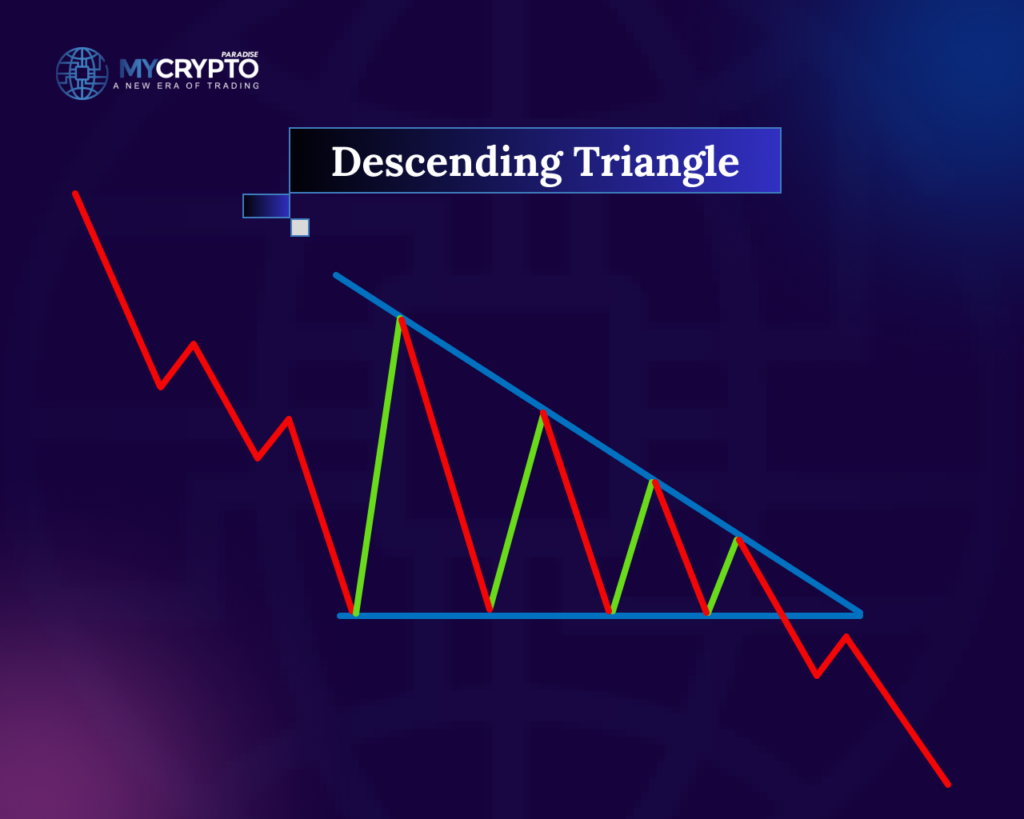
A descending triangle pattern is a bearish continuation pattern that occurs during a downtrend. It is formed by drawing a horizontal trendline at the swing lows and a descending trendline connecting the lower highs (Investopedia). These two trendlines converge to form a triangle-like pattern, hence the name “descending triangle.”
On a candlestick chart the pattern looks like the example below. Each rally stalls a little lower than the one before, while buyers keep defending the same floor. The bounces get weaker until a candle closes below support and sellers take over.
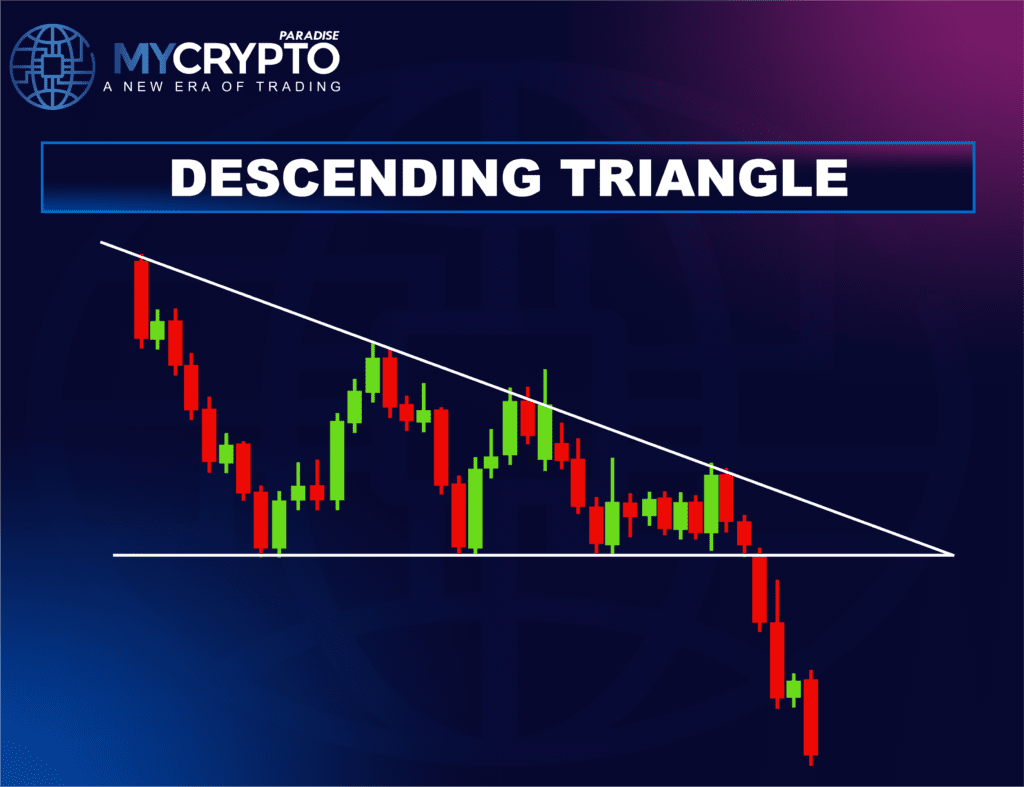
Formation of the Bearish Descending Triangle Pattern
The bearish descending triangle pattern is formed when sellers dominate the market, leading to lower highs and a relatively stable support level. As the price reaches the support level multiple times, it creates a horizontal trendline.
Meanwhile, the descending trendline is formed as lower highs are established. The convergence of these trendlines signifies a period of consolidation and indecision before a potential continuation of the downtrend.
Characteristics of the Bearish Descending Triangle Pattern

1. Duration: The duration of the pattern can vary, ranging from a few weeks to several months, depending on the timeframe being analyzed.
2. Volume: Volume tends to diminish as the pattern develops, indicating decreasing market participation and a loss of bullish momentum.
3. Support and Resistance Levels: The horizontal trendline acts as a strong support level, while the descending trendline serves as resistance. Traders closely monitor these levels for potential breakouts.
How to Recognize a Descending Triangle, Step by Step
The pattern does not appear out of nowhere. It builds in a clear order, and each step shows the balance between buyers and sellers shifting a little further.
- Downtrend context: price is already falling, and sellers defend every lower high.
- Flat support base: price bounces off the same level, but each bounce is weaker.
- Falling resistance line: every rally fades sooner and lower than the last.
- Volume contraction: volume shrinks as the range tightens.
- Bearish breakdown: a candle closes below support, ideally on a volume spike.
- Retest: price often returns to the broken support, which now acts as resistance.
Bearish Breakdown: the Confirmation
The breakdown completes the pattern. What counts is a candle close below the flat support, not an intraday wick through it. Rising volume on that candle shows sellers are committed. A break on thin volume is more likely to fail and slip back inside the triangle.
Retest Confirmation: the Second Chance
After the break, price often rallies back to the old floor. That level now works as resistance. If the retest fails and price turns lower again, you get a second, more cautious entry with a clear invalidation point just above it.
Is the Descending Triangle Bullish or Bearish?
The descending triangle is usually bearish. Most of the time it is a continuation pattern inside a downtrend, and price breaks below support. Context can change the read, though. In a strong uptrend it can break higher instead, and at the top of a rally it can mark a bearish reversal.
Bearish Continuation Triangle
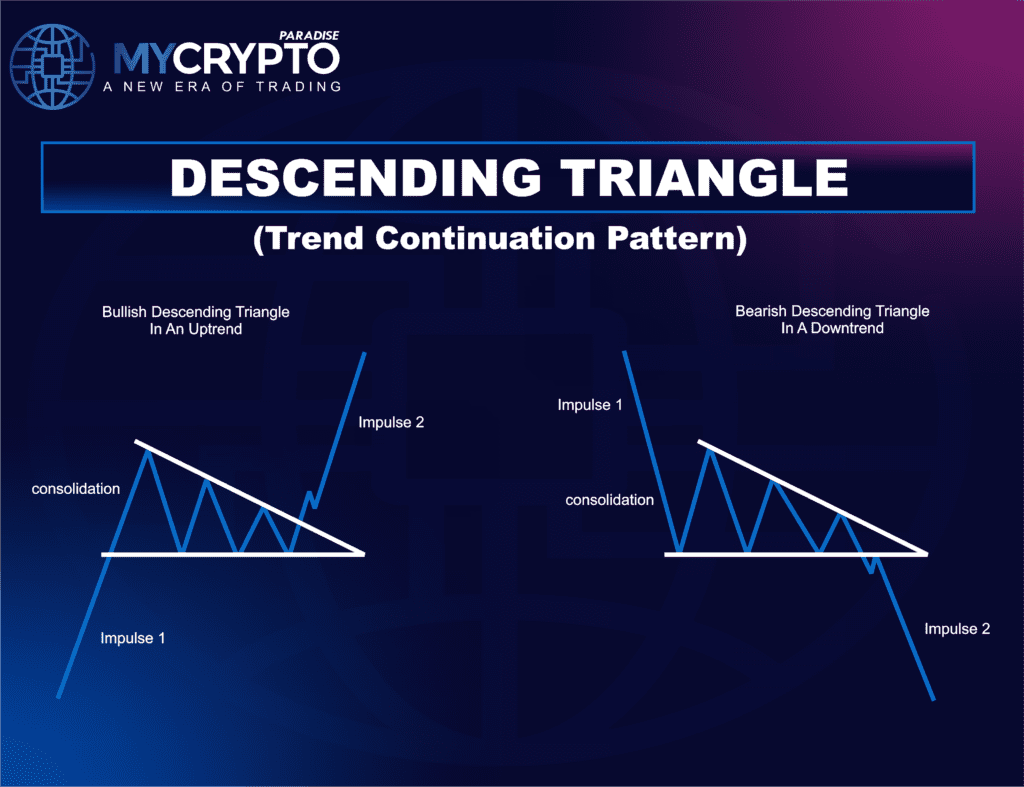
This is the classic case. The triangle forms in the middle of a downtrend while sellers stay in control. Price is squeezed between falling resistance and flat support, and selling pressure builds. A break below support on heavy volume signals that the downtrend is likely to resume.
Bullish Continuation Triangle
Sometimes the same shape appears inside a strong uptrend. Buyers still control the bigger trend, but sellers keep capping each rally at a lower price. When price finally closes above the falling line on strong volume, the pause is over and the uptrend often continues.
The sketch below puts both continuation cases side by side. The shape is the same; only the trend around it and the direction of the break differ. That is why you wait for the breakout instead of assuming the direction.
Bearish Reversal Triangle
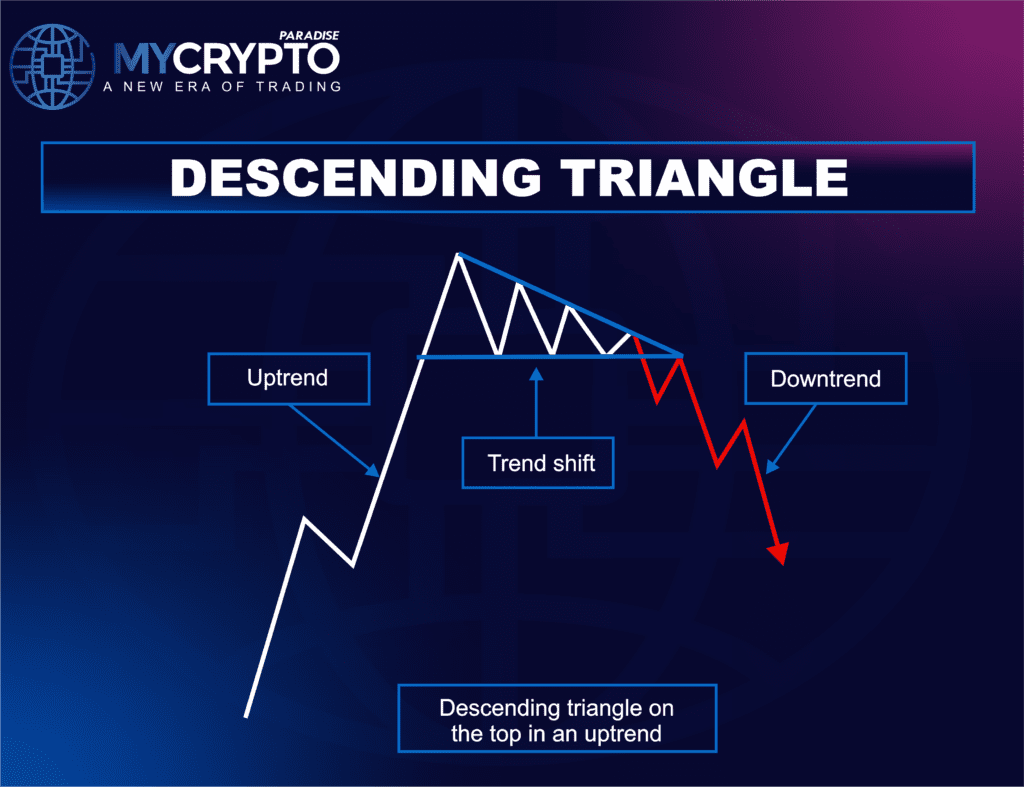
At the top of an uptrend, the pattern means something different. Lower highs stack up against a stubborn floor, which shows buyers running out of steam. A close below that floor marks a trend shift: the uptrend ends and a downtrend can begin.
Interpreting the Bearish Descending Triangle Pattern
1. Bearish Bias:
The bearish descending triangle pattern suggests that sellers are in control, and a breakdown below the support level is expected. Traders interpret this pattern as a continuation signal for the ongoing downtrend.
2. Measuring the Price Target:
To estimate the potential price target, measure the height of the triangle from the highest high to the support level. Then, project this distance downward from the point of breakout. Price targets are not always reached, so confirm them with other indicators.
Trading Strategies for the Bearish Descending Triangle Pattern
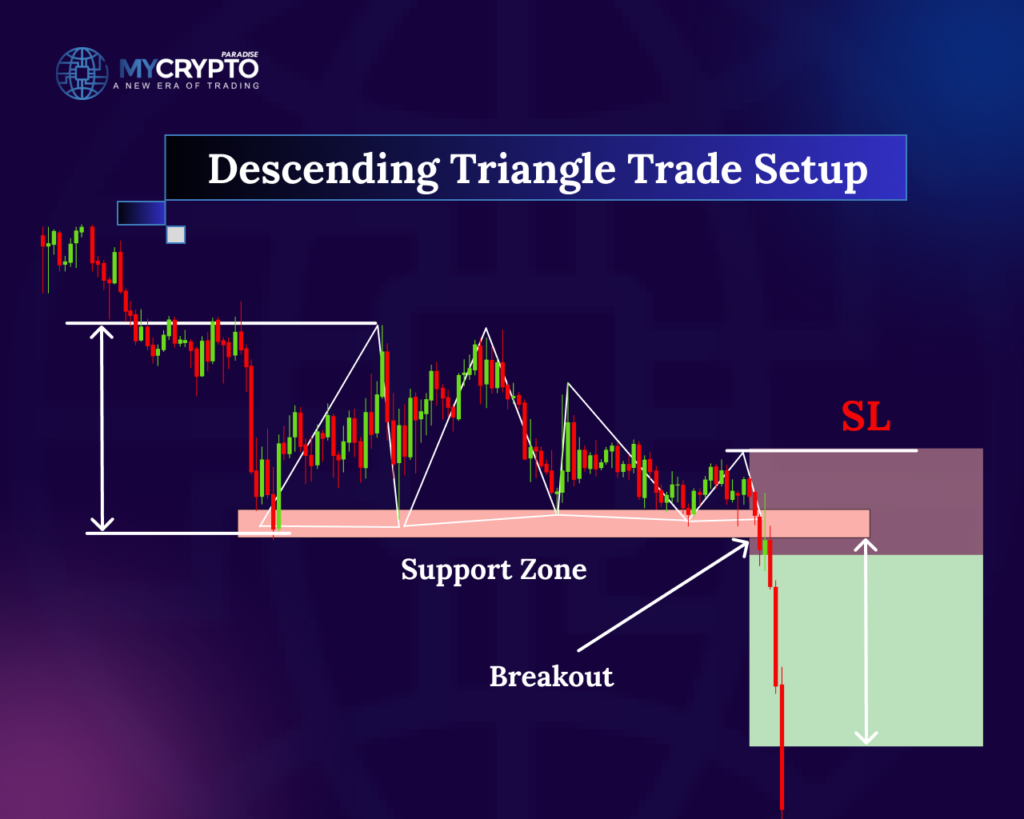
1. Breakout Strategy:
Traders often wait for a confirmed breakdown below the support level before entering a short position. The breakout should ideally be accompanied by increased volume, indicating strong selling pressure. Stop-loss orders are typically placed above the breakout level to manage risk.
2. Retest Strategy:
Some traders prefer to wait for a retest of the support-turned-resistance level after the breakdown. If price fails to climb back above the former support, the bearish case gets stronger. That failure offers a short entry with a tighter stop-loss order.
3. Volume Confirmation:
Volume analysis is crucial when trading the bearish descending triangle pattern. A breakout accompanied by high volume reinforces the validity of the pattern and increases the likelihood of a successful trade.
Limitations and Considerations for the Bearish Triangle Pattern
1. False Breakouts:
False breakouts can occur, where the price briefly breaks below the support level but quickly recovers, trapping traders who entered short positions. To minimize false signals, it is recommended to wait for a confirmed breakdown and consider using additional technical indicators for confirmation.
2. Market Environment:
It is crucial to consider the broader market context when trading the bearish descending triangle pattern. Factors such as overall market trend, news events, and sector-specific dynamics can influence the effectiveness of the pattern.
How to Measure the Trading Parameters For Bearish Triangular Pattern

When you trade the bearish descending triangle, set the entry, stop loss and take profit before you open the position. That keeps the risk defined if the breakdown fails. Here is how to set each one.
1. Entry Point:
Breakout entry: One common approach is to enter a short position on a confirmed breakdown below the support level of the pattern. The breakdown should ideally come with increased volume, which shows strong selling pressure.
Retest entry: Other traders wait for a retest of the support-turned-resistance level after the breakdown. If price fails to reclaim the former support, it confirms the bearish read and offers a short entry.
2. Stop Loss:
There are three common places for the stop loss, from tightest to widest:
- Above the breakout level: used when you short the breakdown itself; it exits fast if the break fails.
- Above the retest high: used after a retest entry, and usually tighter than the pattern stop.
- Above the last lower high: the pattern stop; if price climbs back over it, the triangle has failed.
3. Take Profit:
Measuring the pattern: Measure the height of the triangle from its highest high to the support level. Project that distance down from the breakout or retest point to estimate a target. Targets are estimates, not promises, so confirm them with other levels and indicators.
Support levels: Another approach targets key support zones, previous swing lows or Fibonacci levels, where buyers often step in. Watching price action and volume there helps you decide whether to exit in part or in full. You can consult with our professional team of crypto traders in ParadiseFamilyVIP🎖️.
A Worked Example on the Chart
The chart below puts the whole plan on one setup. Swing lows 1 and 3 form the flat support, while the lower highs at 2 and 4 form the falling resistance line. Point 5 is the candle that closes below support, and that close is the entry.
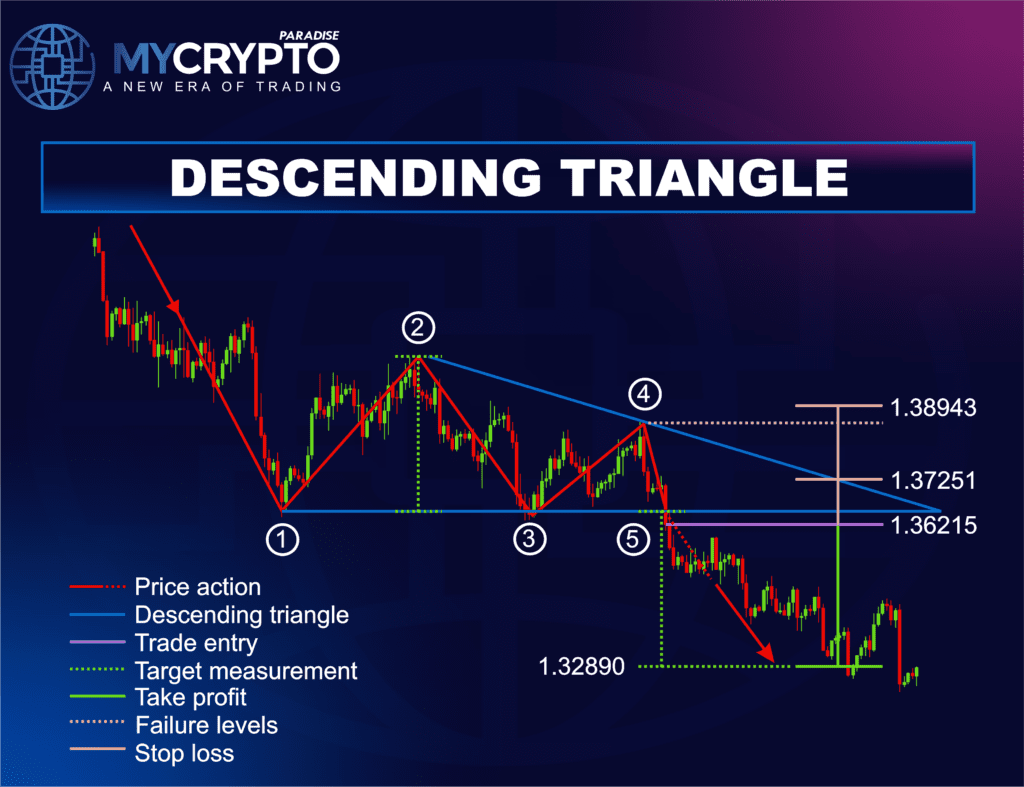
The target is the triangle’s height, from high 2 down to support, projected down from point 5. The chart marks two stop loss levels: a tight one on the falling line and a wider one above the point 4 high. The dotted line at point 4 is the failure level: above it, the pattern has failed.
In round numbers, support sits at $100 and the first high inside the triangle is $110, so the height is $10. Say the short fills near $99 after the close below $100. The measured target is about $90. A stop at $104, above the last lower high, risks about $5 to aim for about $9.
Many breakdowns stall before the target, so a planned partial exit helps. Size the position so the loss at the stop is an amount you can accept. Before you enter, check the balance of the trade with a risk reward ratio.
What Makes a Descending Triangle Signal More Reliable?
A descending triangle signal is more reliable when it forms inside a clear downtrend and price closes below flat support. Volume should shrink while the pattern builds, then jump on the break. A matching read on the daily or weekly chart, confirming indicators and a break before the apex all add weight. No pattern works every time.
1. Strong Downtrend:
A bearish descending triangle pattern is considered more reliable when it forms within the context of a strong and established downtrend. The presence of a clear downtrend suggests that sellers have control, increasing the likelihood of a continuation of the downward move.
2. Volume Confirmation:
Volume analysis is essential when trading the bearish descending triangle pattern. The typical footprint is volume shrinking while the triangle forms, then jumping on the break. A breakdown on rising volume confirms strong selling pressure, while a quiet break deserves more caution.
3. Price Target Projection:
Measuring the height of the triangle and projecting it downward from the breakout point gives a potential price target. It is a rough estimate of the downside move, not a promise that price gets there.
Use this projection as a guide, and confirm it with support levels or other indicators.
4. Multiple Timeframe Analysis:
Analyzing the bearish descending triangle pattern across multiple timeframes gives a broader perspective. A pattern that also shows on the daily or weekly chart carries more weight. A triangle that fights the higher timeframe trend is a weaker signal.
5. Confluence with Other Indicators:
Other tools that point the same way add confirmation. An overbought Relative Strength Index (RSI) reading near resistance adds weight, and so does a bearish candlestick pattern at the last lower high. Momentum indicators that show buyers weakening while support holds tell the same story.
6. Risk Management:
Proper risk management is crucial for trading success. Use appropriate position sizing, set stop loss orders to manage risk, and consider adjusting your stop loss as the trade progresses. Additionally, keep an eye on the overall market environment, news events, and sector-specific dynamics, as these factors can impact the effectiveness of the pattern.
7. Breakdown Before the Apex:
Where the break happens inside the triangle matters. A break that comes before price is squeezed into the tip tends to carry more force. A break right at the apex often fizzles, because the two lines have nearly met and the squeeze is spent.
Descending Triangle vs Similar Chart Patterns
Several bearish patterns look alike at first glance. The descending triangle stands out because of its flat support, which gives you one exact breakdown level to plan around.
| Pattern | Shape | How it differs from a descending triangle |
|---|---|---|
| Descending triangle | Flat support and falling highs | One clear breakdown level, with a bearish bias inside a downtrend |
| Descending channel | Two parallel falling lines | A steady grind lower with no flat floor, so there is no single trigger level |
| Rising wedge | Rising highs and rising lows that converge | Looks bullish while it forms, then usually breaks down, so confirmation matters |
| Bear flag | A sharp drop, then a short upward or sideways pause | Forms fast after a flagpole, while a triangle builds slowly against support |
The practical difference is planning. The flat floor lets you set the entry, stop and target more precisely than on a drifting channel or a wedge.
Common Mistakes to Avoid With the Descending Triangle
Spotting the pattern is the easy part. These mistakes turn a sound setup into an avoidable loss:
- Shorting before the break: until a candle closes below support, there is no signal.
- Trusting a weak break: a poke below support on low volume is often a fake-out.
- Forcing the pattern: lower highs are not enough; support must be flat and tested several times.
- Ignoring the higher timeframe: a bearish triangle against a strong weekly uptrend is a weaker trade.
- Poor risk management: stops that are too tight or too wide, or oversized positions, drain capital fast.
- Ignoring the news: sudden volatility can break any technical setup, however clean it looks.
Conclusion
The bearish descending triangle pattern is a popular technical pattern used by traders to identify potential shorting opportunities in a downtrending market. Its formation, characterized by a horizontal support level and a descending trendline, indicates a period of consolidation before a potential continuation of the downtrend.
The technical knowledge shared in this article is a great tool, but it’s not enough by itself to guarantee long-term success. You must combine this knowledge with effective trading strategies and proven tactics to apply it well over time.
At ParadiseFamilyVIP🎖️, we integrate expert technical analysis, on-chain insights, real-time sentiment monitoring, and whale psychology with solid trading strategies to make informed decisions for our crypto signals and portfolio management.
👉Check the availability of membership in ParadiseFamilyVIP🎖️ (Click it)
Our premium service is designed for traders with enough capital. If you’re still building your funds, we recommend starting with our FREE Telegram channels.
Descending Triangle FAQ
What does a descending triangle pattern indicate?
It is a bearish continuation pattern showing sellers dominate as lower highs press against a flat support level. It usually points to a breakdown below support and a continuation of the existing downtrend.
What is the difference between a descending triangle and a falling wedge?
A descending triangle has a flat support line under falling highs, and it usually breaks down. A falling wedge has two falling lines that converge, so both the highs and the lows keep dropping. The lows fall more slowly than the highs, and the wedge usually breaks upward as selling pressure fades.
How do you set a price target for a descending triangle?
Measure the height of the triangle from its highest high to the support level, then project that distance downward from the breakout point. Targets are estimates only, so confirm with support levels or other indicators.
Where do you place a stop loss when trading a descending triangle?
Most traders place the stop just above the last lower high inside the triangle. If price climbs back above that level, the pattern has failed. Traders who enter on a retest can use a tighter stop just above the retest high. Either way, size the position so the loss at the stop stays acceptable.
Why does volume matter in this pattern?
Volume often shrinks as the triangle forms, reflecting fading momentum. A breakdown on rising volume confirms strong selling pressure and improves the reliability of the signal, while a low-volume break is more prone to failure.
How can traders avoid false breakouts?
Wait for a confirmed close below support rather than an intraday wick, and consider a retest of support-turned-resistance before entering. Adding tools like RSI or candlestick confirmation helps filter out traps.
Crypto trading involves substantial risk of loss. This article is educational and is not financial advice. Past performance does not guarantee future results. Always do your own research.
What is different here
Most guides stop at the theory. The MyCryptoParadise team shares the live trades, and the reasoning behind each one, inside ParadiseFamilyVIP. Everything here is education, not financial advice.
Crypto trading involves substantial risk and is not suitable for everyone. Nothing here is financial advice; it is education only. Never risk more than you can afford to lose.












Join the discussion
No comments yet. Members, share how you are reading this.