



Chart Pattern Basics
In short
A symmetrical triangle is a crypto chart pattern characterized by price compression between two converging trendlines: a falling line of lower highs and a rising line of higher lows. It indicates market indecision and building pressure, signaling a pause where neither buyers nor sellers are in full control. The pattern suggests that a breakout is likely to occur, but it does not predict the direction of the future price movement.
- A symmetrical triangle usually forms when the market starts calming down after a strong move. Instead of continuing in the same direction, the price begins to tighten, creating smaller swings with lower highs and higher lows as momentum slows down.
- During this stage, the market is basically taking a pause. Buyers try to push the price up while sellers push it back down, but neither side gains full control. Because buyers and sellers keep pushing against each other, the price range slowly tightens, and market volatility fades as the price gets squeezed into a narrower structure.
- But this quiet phase rarely lasts long. As the triangle tightens, the likelihood of a breakout tends to increase. That said, the pattern alone isn’t enough to base a trade on.
The Symmetrical Triangle Pattern is one of those formations that almost every crypto trader recognizes sooner or later. Spend enough time staring at crypto charts, and you’ll start spotting them everywhere.
At MCP University FREE, we teach crypto traders to pay attention to these moments. Not because triangles magically predict the future, they don’t, but because they often show when the market is building pressure. Understanding how they form and how to trade them properly can make a big difference.
What is the Symmetrical Triangle Pattern?
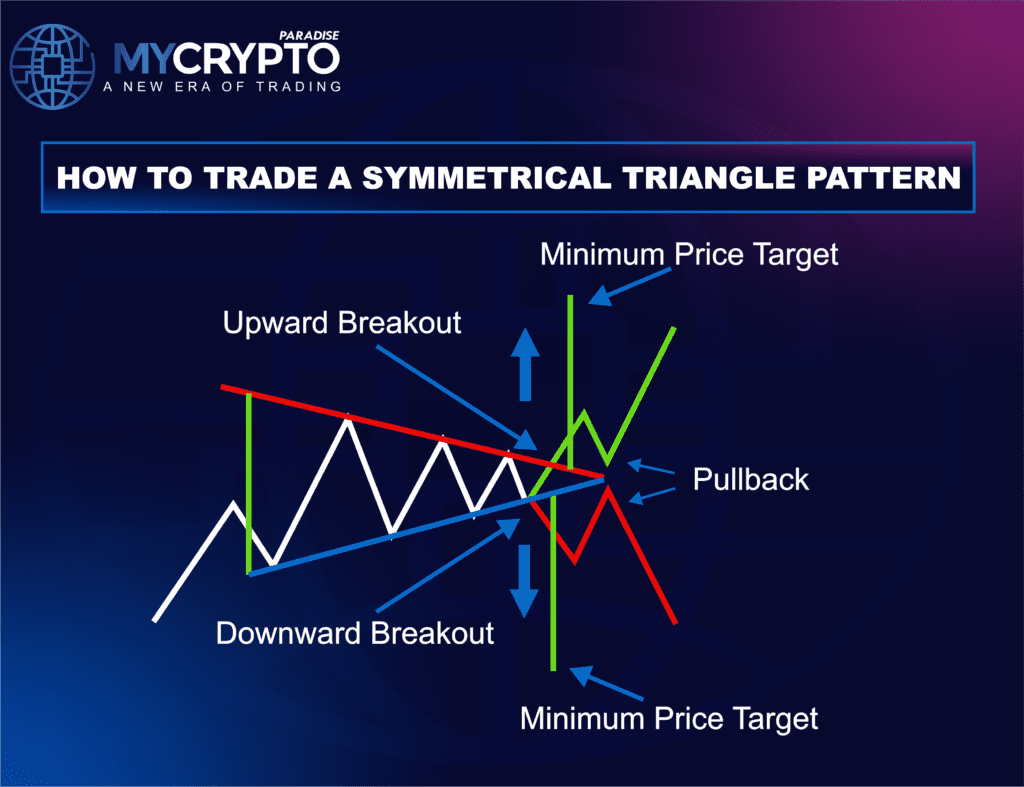
The symmetrical triangle is a technical chart pattern where price compresses between two converging trendlines. One trendline slopes downward, connecting a series of lower highs. The other slopes upward, connecting higher lows. Over time, the two lines move toward each other, forming the triangular structure that crypto traders recognize. It sounds simple, and visually it is, but what happens inside that triangle is where things get interesting.
Imagine Bitcoin rallies aggressively over a few days. Crypto traders rush in, momentum builds, and price climbs quickly. Eventually, the rally slows down. Some crypto traders start taking profits. Others begin shorting, expecting a pullback. New buyers enter on dips. Instead of trending strongly in one direction, the price begins bouncing back and forth.
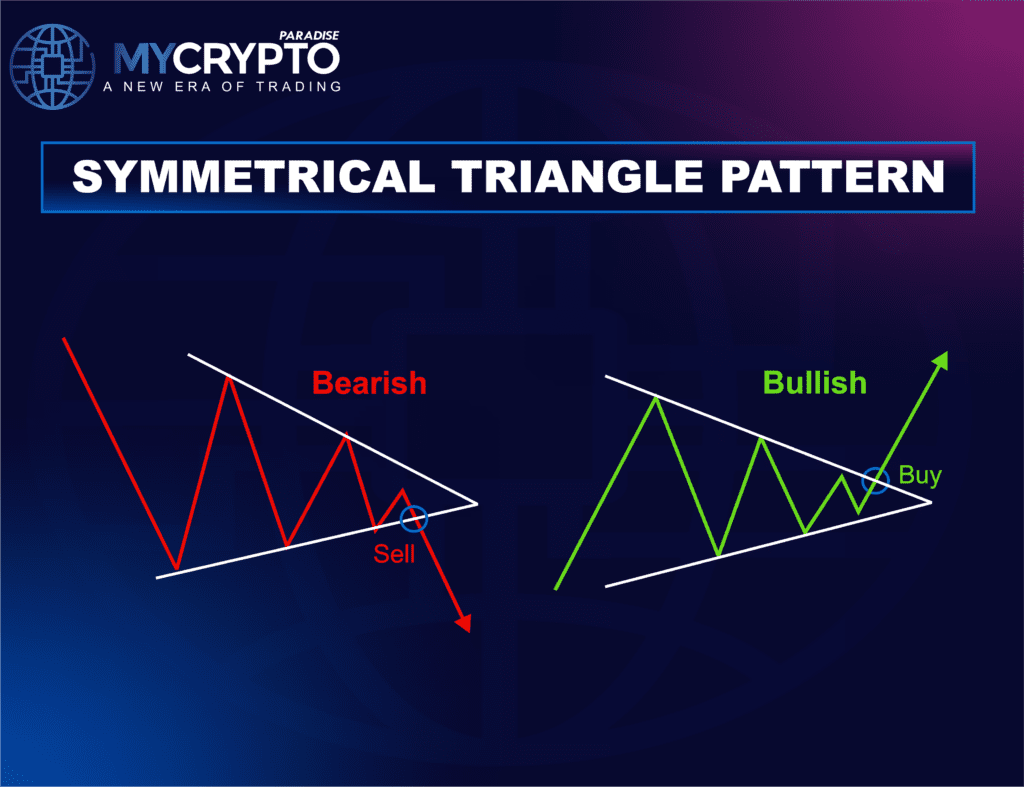
Each rally stops slightly lower than the last. Each dip gets bought slightly higher. That’s the compression forming. Crypto traders who missed the earlier move begin paying attention again, waiting for the breakout that might trigger the next wave of volatility. The market feels quiet. But beneath the surface, tension is building.
The Psychology Behind the Pattern
Charts are really just visual representations of human behavior. Fear, greed, hesitation, conviction, it all shows up in the candles. The symmetrical triangle is essentially a picture of market indecision.
After a strong move, traders begin questioning the next direction. Some believe the trend will continue. Others believe the move has gone too far. Buyers step in. Sellers push back. Neither side manages to dominate, so the price compresses into a tighter and tighter range.
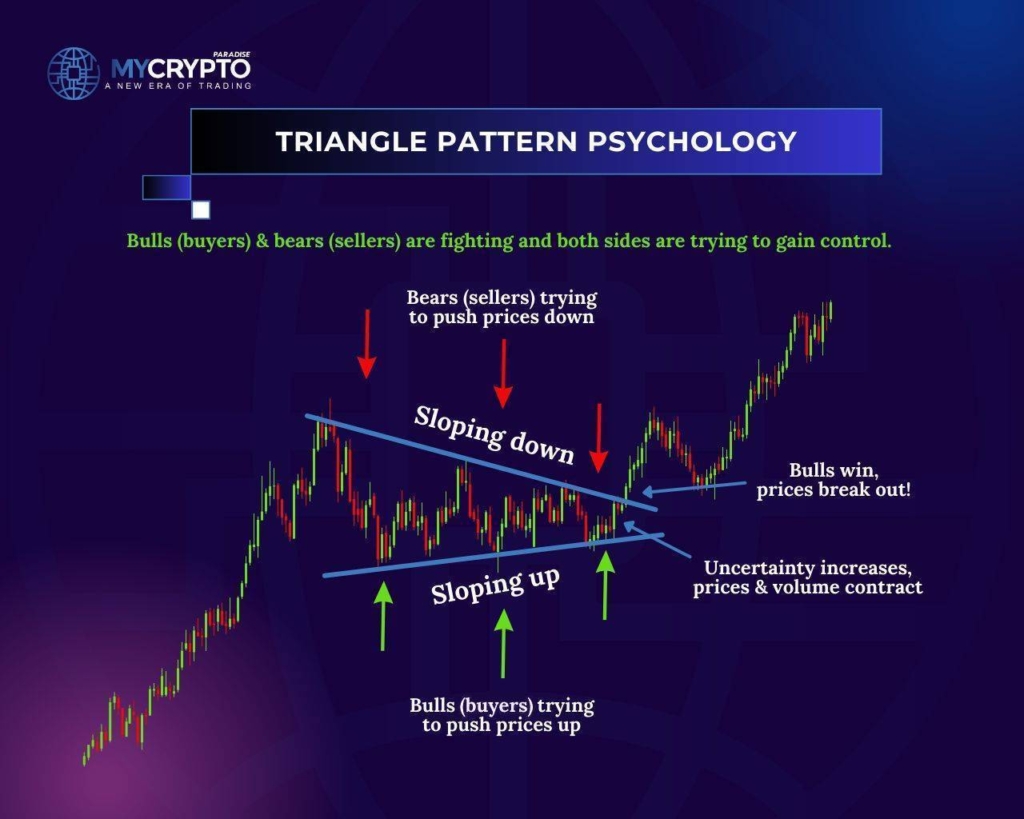
If you’ve ever watched a triangle form in real time, you’ll notice something interesting: the market gradually becomes quieter. Candles shrink. Volume slows down. Volatility fades. The energy disappears from the chart. But experienced crypto traders understand that quiet markets rarely stay quiet forever. Eventually, the market reaches a point where one side finally takes control. And when that happens, the move can accelerate quickly.
How to Identify the Symmetrical Triangle Pattern
After watching charts for a while, you start noticing symmetrical triangles without much effort. A few small signs on the chart usually make it clear when this pattern is forming.
Converging Trendlines
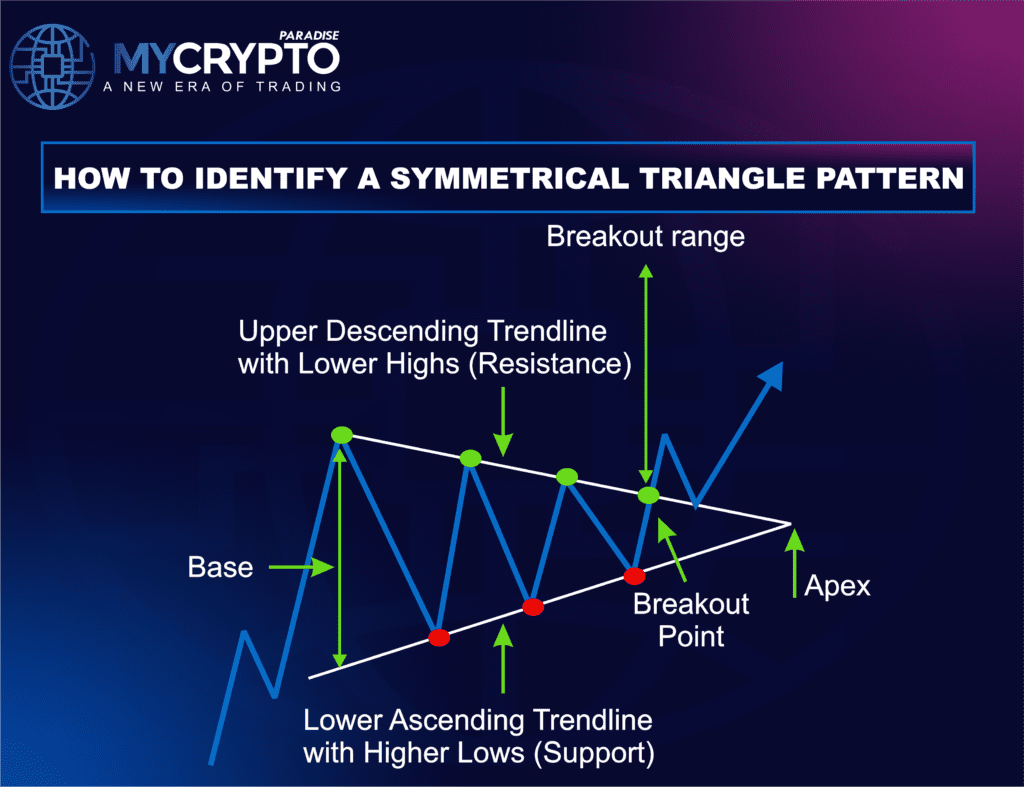
The first thing you’ll notice is two trendlines slowly coming closer together. The upper line forms from lower highs, while the lower line is created by higher lows. As the price moves back and forth between them, the distance between the lines gradually gets tighter.
Multiple Touchpoints
A triangle becomes more trustworthy when the price respects both trendlines several times. Usually, you want to see at least two or three touches on each side. Every bounce shows that the market is actually reacting to those levels and not just moving randomly. A trendline that breaks and gets redrawn flatter from the same origin is a different tool: the fan principle, which tracks a fading trend.
Gradual Volatility Contraction
Another thing you’ll often notice is that volatility starts to shrink. Early on, the price swings can still be fairly wide. But as the triangle develops, the swings in price usually shrink and move closer together. It’s almost like the market is slowly building pressure before making its next move.
Volume Behavior
Volume can also give you a useful clue. Most of the time, it starts dropping while the triangle is forming because traders are waiting for a clearer direction. A simple trick many crypto traders use is to watch volume near the breakout. If price breaks out of the triangle and volume starts picking up again, it’s often a sign that momentum is coming back into the market.
Is the Symmetrical Triangle Pattern Bullish or Bearish?
A lot of crypto traders wonder whether a symmetrical triangle means the market is about to go up or down. The simple truth is that it can go either way. The pattern itself is usually seen as neutral, so the surrounding market context matters a lot.
Triangle During an Uptrend
If a triangle shows up while the market is already pushing higher, it often just reflects a brief slowdown in the trend. You can often see this kind of structure when the market slows down for a bit instead of reversing completely. If the price later breaks above the triangle, it usually suggests buyers are still present, and the move upward may continue.
Triangle During a Downtrend
A similar situation can happen in a falling market. After a strong drop, the price doesn’t always keep falling right away. Quite often it just… slows down. The market starts moving in a smaller range, almost like it’s catching its breath. When that happens, you might notice a triangle starting to form on the chart. It doesn’t necessarily mean the trend is changing; many times it’s simply a short pause before sellers step in again.
Triangle During a Sideway
You’ll also see triangles show up when the market is already stuck moving sideways. Price moves up a bit, then down again, without really going anywhere.
Because of that, a lot of crypto traders don’t rush the trade. They usually wait until the price finally breaks out of the triangle. That move tends to give a clearer hint about where things go next.
How Reliable Is the Symmetrical Triangle Pattern?
No chart pattern works perfectly, and triangles are no exception. You’ll often hear crypto traders say the pattern works around 60% or even 70% of the time. A triangle that forms in the wrong market environment can still lead to a poor trade, no matter what the statistics suggest.
What Do Published Pattern Statistics Show?
Thomas Bulkowski, author of the Encyclopedia of Chart Patterns, publishes symmetrical triangle statistics built from over 3,000 bull-market trades. The sample is stocks, not crypto, so treat it as a reality check rather than a crypto forecast.
| Measure (bull-market stocks) | Upward breakout | Downward breakout |
|---|---|---|
| Share of breakouts in that direction | 60% | 40% |
| Reached the full measured target | 58% | 36% |
| Failed to move at least 5% | 25% | 37% |
| Returned to the breakout price within 30 days | 62% | 65% |
Source: Thomas Bulkowski, thepatternsite.com, symmetrical triangle statistics, read in September 2026.
Two lessons stand out. In this data, 60% is the share of breaks that go up, not a win rate. A retest of the breakout line is also the normal case. A touch of the line is common; a close back inside the triangle is the warning.
Bulkowski also ranks the symmetrical triangle 36th of 39 patterns for upward breakouts. That is why we treat it as a map of building pressure, not a signal on its own.
Situations Where Triangles Tend to Work Better
- Triangles perform better when a few conditions are present at the same time.
- They behave better after the market has been trending for a while.
- If the price was moving strongly before the pattern, the breakout often continues that move.
- Traders watch volume; rising activity as price exits the triangle can indicate more traders are involved.
- Quiet markets can cause prices to slip out and drift back inside the triangle.
- Breakouts hitting nearby resistance or support may slow or reverse.
- Alignment with higher-timeframe charts can help the breakout travel further.
- When several of these elements appear together, the breakout move is more convincing.
Situations Where Triangles Can Struggle
- Triangles become less dependable in certain environments.
- Sideways markets can cause triangles to form, but fail to produce strong breakouts.
- In crypto, false breakouts are common.
- Price may appear to break out, then slide back in.
- Many crypto traders wait for proper confirmation before acting.
How to Trade the Symmetrical Triangle Pattern
Finding a symmetrical triangle on a chart is not particularly difficult. Many beginners learn to recognize the shape quickly. The tricky part comes when it’s actually time to trade. Staying patient, following a plan, and managing risk consistently are what separate casual crypto traders from those who are more disciplined.
Entry Considerations
Close-Confirmation Entry
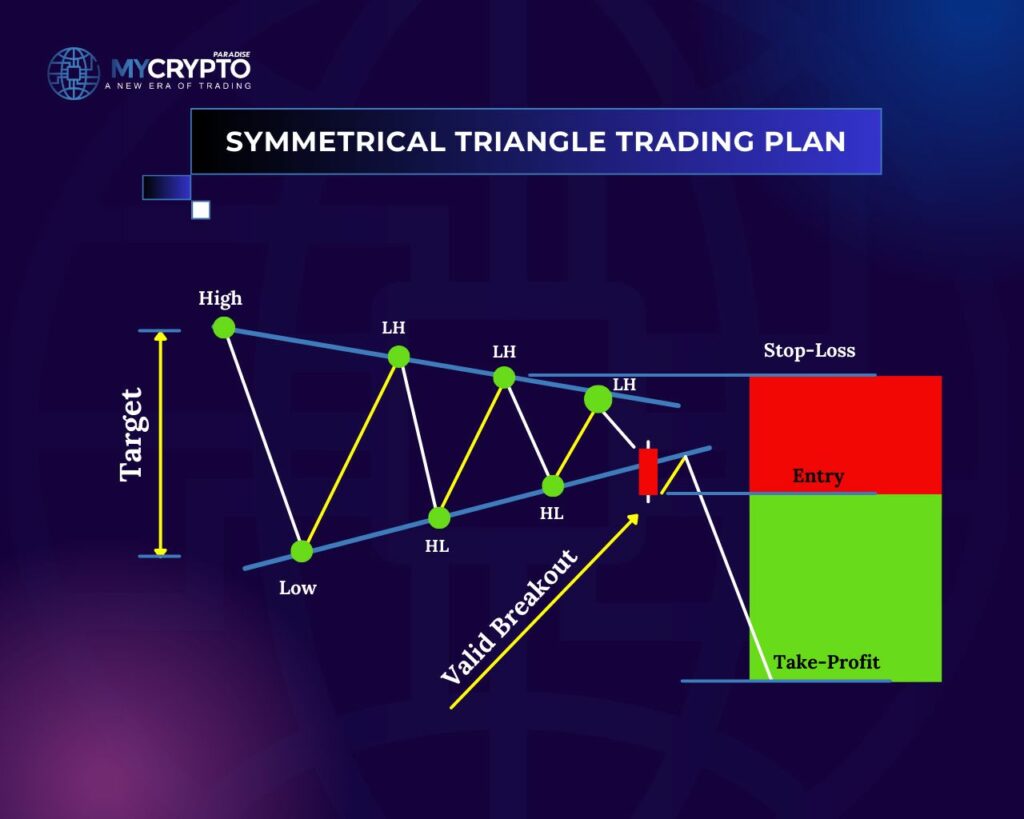
A lot of crypto traders prefer to wait until a candle clearly closes outside the triangle before jumping in. If you enter too soon, you might get caught by price briefly poking outside and then slipping back inside before the candle finishes. What really matters is the closing price. When a candle closes firmly outside the structure, it usually shows that one side of the market has gained control.
Break-of-Structure Entry
Another method some crypto traders use involves waiting for a break beyond the most recent swing high or swing low after the triangle breakout. Taking that extra step can give a bit more confidence that the move has real momentum behind it.
Stop-Loss Placement
- Stop-loss levels should be placed according to structure rather than emotion.
- Many crypto traders position stops outside the opposite side of the triangle.
- Others place stops just beyond the most recent swing high or swing low.
- A good place to place a stop-loss is slightly beyond the breakout point to allow for minor price fluctuations.
- That level represents the point where the trade idea no longer makes sense.
- If the price returns inside the triangle after the breakout, the original setup may no longer be valid.
Take-Profit Targets
- Most crypto traders look at previous support or resistance levels, recent swing highs or lows, or areas where price reacted earlier.
- Some take the height of the triangle and project it from the breakout point for a rough target.
- A simple way to set a profit target is to use the nearest significant support or resistance as your exit point.
- Targets should make sense based on what the market is doing, not just a random number.
A worked example, with hypothetical numbers. A BTC triangle opens with a $66,000 high and a $60,000 low, a height of $6,000. A 4-hour candle then closes above the upper line at $63,500. The full measured target is $63,500 plus $6,000, or $69,500.
The published data suggests trimming that, because only 58% of upward breaks reached the full target. Scaling the height by 58% gives a closer first target near $67,000. A stop just below the last higher low, say $62,200, risks $1,300 against about $3,500 to that first target.
A Pre-Trade Checklist for Symmetrical Triangles
Run the same short list before every breakout trade. It keeps the decision about structure and risk, not about the last candle.
- Confirm two or more touches on each trendline.
- Note the trend that led into the triangle.
- Wait for a candle to close outside the pattern.
- Check that volume rises on the breakout candle.
- Set the stop and target first, then size the position from the stop.
- Reassess if price closes back inside the triangle.
Which Indicators Help Confirm a Symmetrical Triangle Breakout?
A triangle shows where pressure is building; an indicator helps judge whether the break has real force. Moving averages, RSI (Relative Strength Index), Bollinger Bands, MACD (Moving Average Convergence Divergence) and Fibonacci extensions each add a different view. Use one or two that measure different things, because five indicators reading the same candles are still one opinion.
| Indicator | What to check at the breakout | What it adds |
|---|---|---|
| 50-period moving average | Price above a rising average for an upside break, below a falling one for a downside break | Trend direction |
| RSI | Above 50 supports an upside break and below 50 a downside one; above 70 warns the move is stretched | Momentum, plus an early pullback warning |
| Bollinger Bands | The bands narrow while the triangle forms, then price closes outside a band | Volatility returning after the squeeze |
| MACD | The MACD line crosses its signal line in the breakout direction | Momentum turning with price |
| Fibonacci extensions | The 1.272 and 1.618 levels of the move that led into the triangle | Further targets to compare with the measured move |
RSI and MACD overlap more than they differ, since both read momentum. Our guides on combining RSI with other indicators and reading the MACD show how to pair them without doubling up.
None of these tools changes the core rule. The close outside the triangle comes first, and the indicator only adds or removes confidence.
Symmetrical Triangle Compared with Similar Patterns
Triangles appear quite often on price charts, and that’s one reason crypto traders sometimes confuse them with other patterns. At first glance, many of these formations look similar. However, the structural differences between these patterns matter more than they initially appear.
Symmetrical vs Ascending Triangle
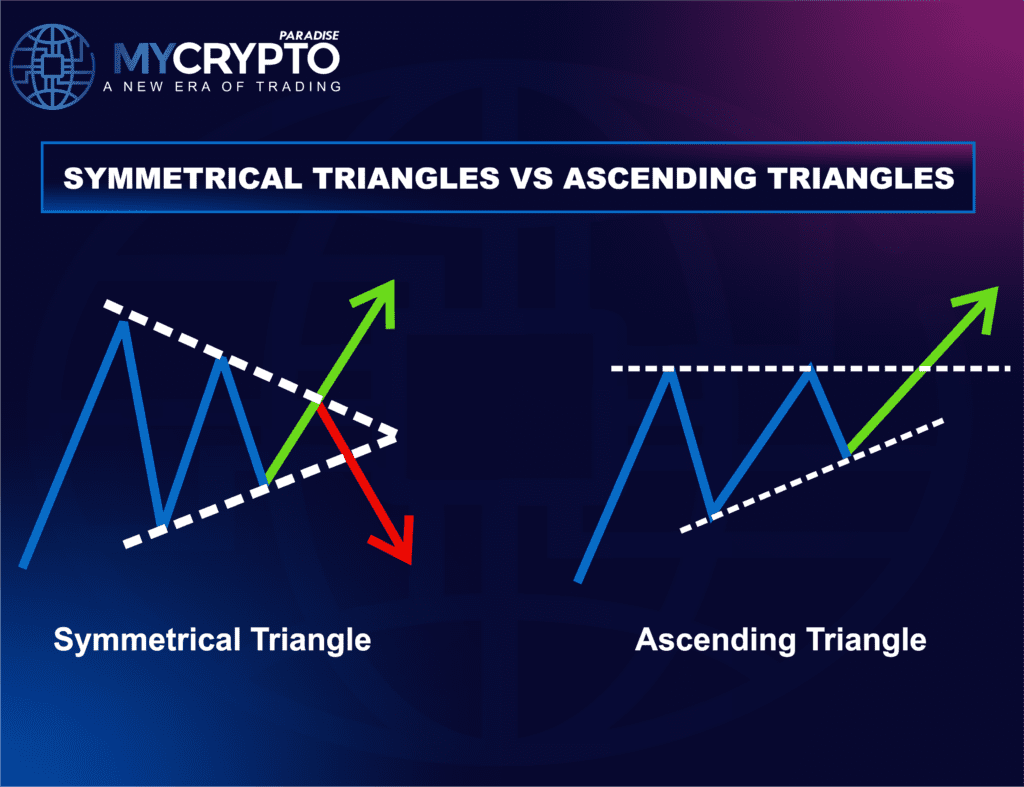
A symmetrical triangle forms when price produces lower highs and higher lows at the same time. It basically means buyers and sellers are still fairly balanced, while the price range slowly starts getting tighter.
An ascending triangle behaves a bit differently. In that pattern, resistance tends to stay relatively flat while support continues rising. Buyers keep stepping in at higher levels, which slowly pushes the market toward the same resistance zone. Because pressure builds from below, ascending triangles often lean slightly bullish.
Here is that flat ceiling on a real chart. On the KNC/USDT perpetual 6-hour chart in March and April 2023, each dip bottomed higher while every rally stalled near $0.765.
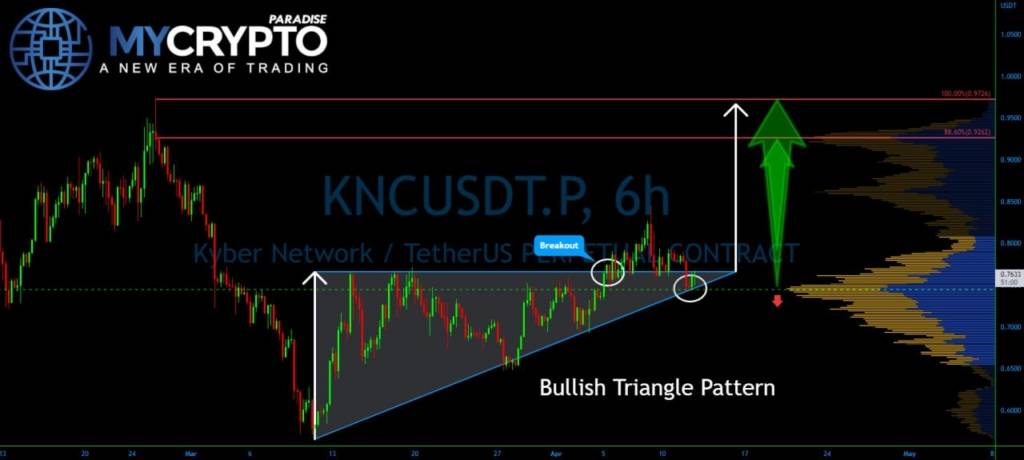
The chart marks the breakout above that ceiling, a later dip back to the rising trendline and a measured target near $0.97. It shows the plan, not the result. In a symmetrical triangle, the upper line would slope down instead of staying flat.
Symmetrical vs Descending Triangle
A descending triangle shows the opposite structure. On this pattern, support usually stays around the same level. Resistance, however, keeps drifting lower as time passes. Because of that, sellers tend to step in at progressively lower prices, and little by little, the market gets pushed back toward the support area.
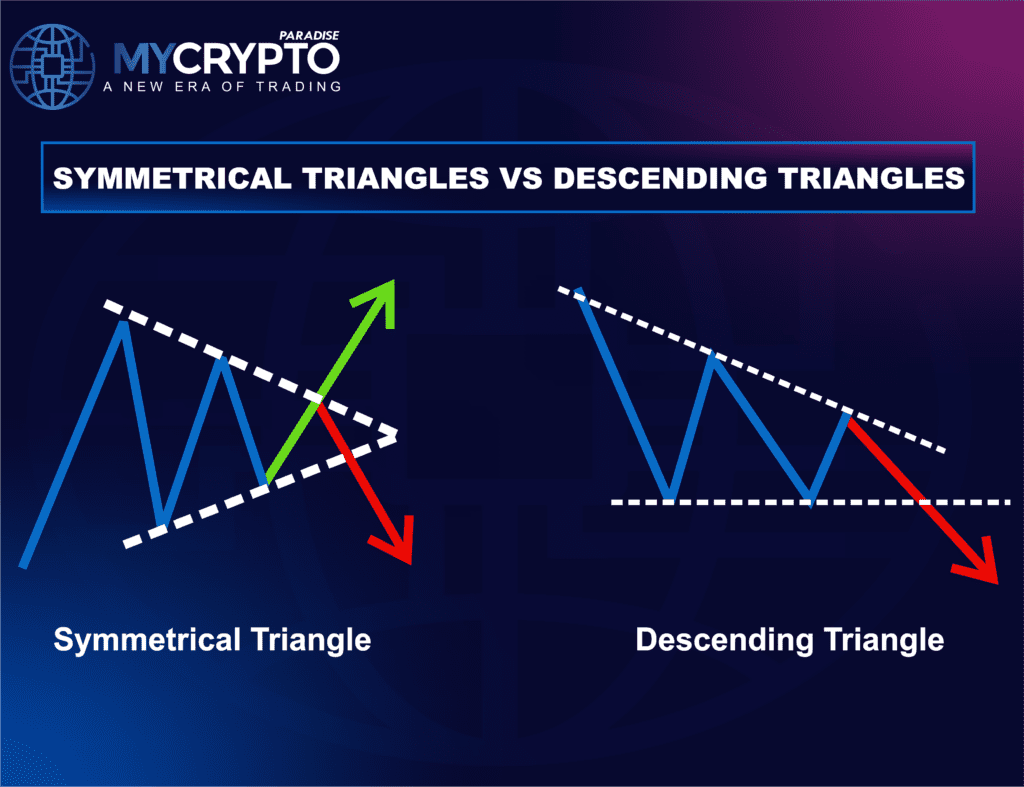
Because of this repeated selling pressure, descending triangles often develop a bearish bias. Symmetrical triangles, in contrast, stay more neutral until the breakout direction becomes clear.
Symmetrical Triangles and Wedge Patterns
Sometimes people confuse wedges with triangles since both have two trendlines that come together. The main difference is really in how those lines slope. In a wedge, both lines usually move in the same direction, either up or down, instead of leaning toward each other like in a triangle.
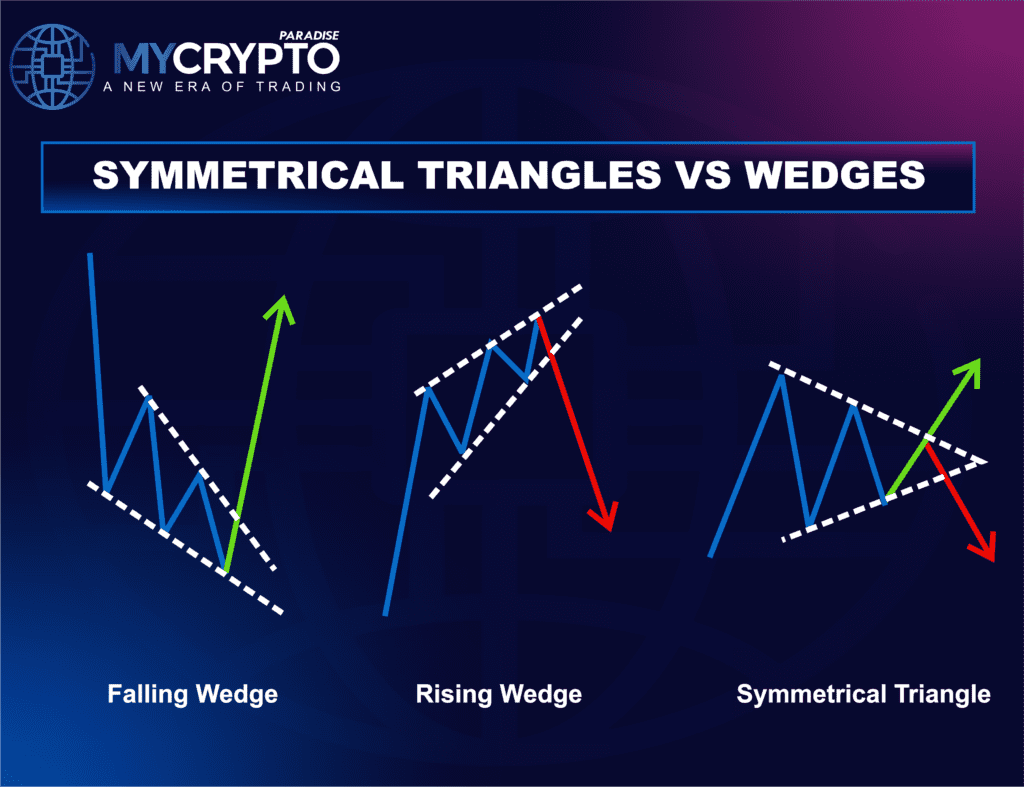
They may both slope upward or both slope downward. In a symmetrical triangle, the lines move toward each other from opposite directions, which reflects a different type of market compression
Symmetrical Triangle vs Pennant
You know, pennants sometimes look a lot like symmetrical triangles, mostly after the price has just shot up or down. Usually, they form right after a sharp push in price, then things pause for a bit before continuing in the same direction.
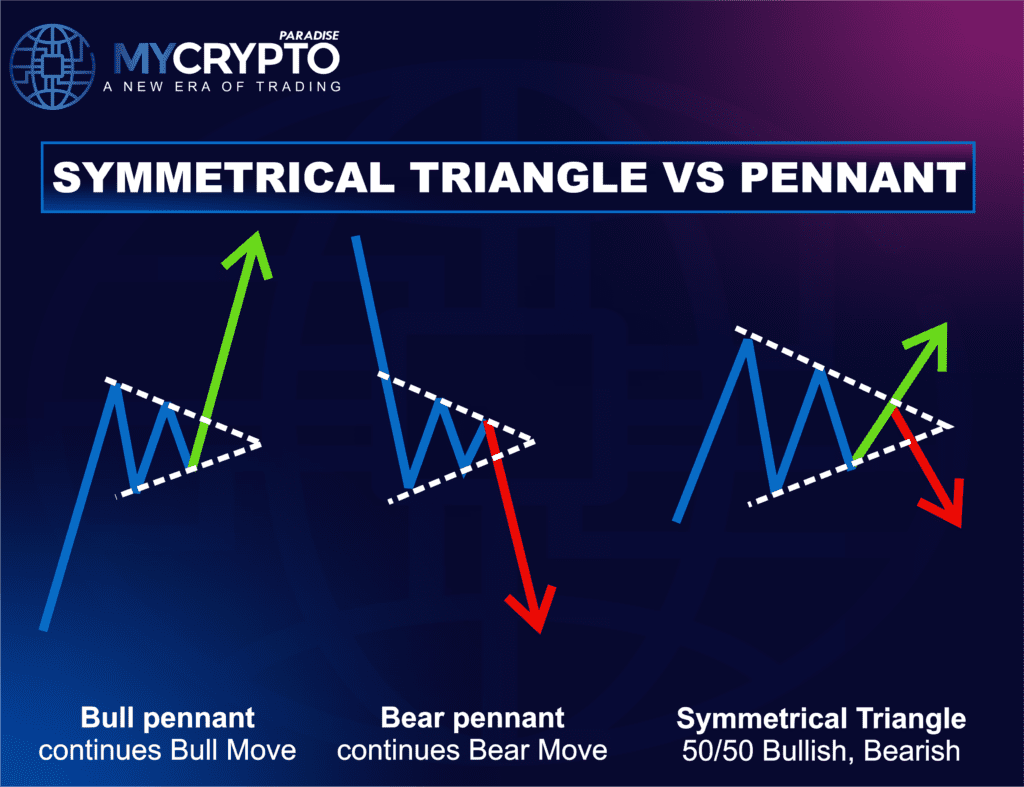
The big difference is mostly context. Pennants tend to keep the trend going. Symmetrical triangles can appear during longer periods where the market is just tightening up and waiting for its next move.
Symmetrical vs Expanding Triangle
Expanding triangles are almost the opposite of symmetrical ones. Instead of squeezing, the range actually widens, with price making higher highs and lower lows. It’s kind of a sign that volatility is picking up and the market is getting less predictable.
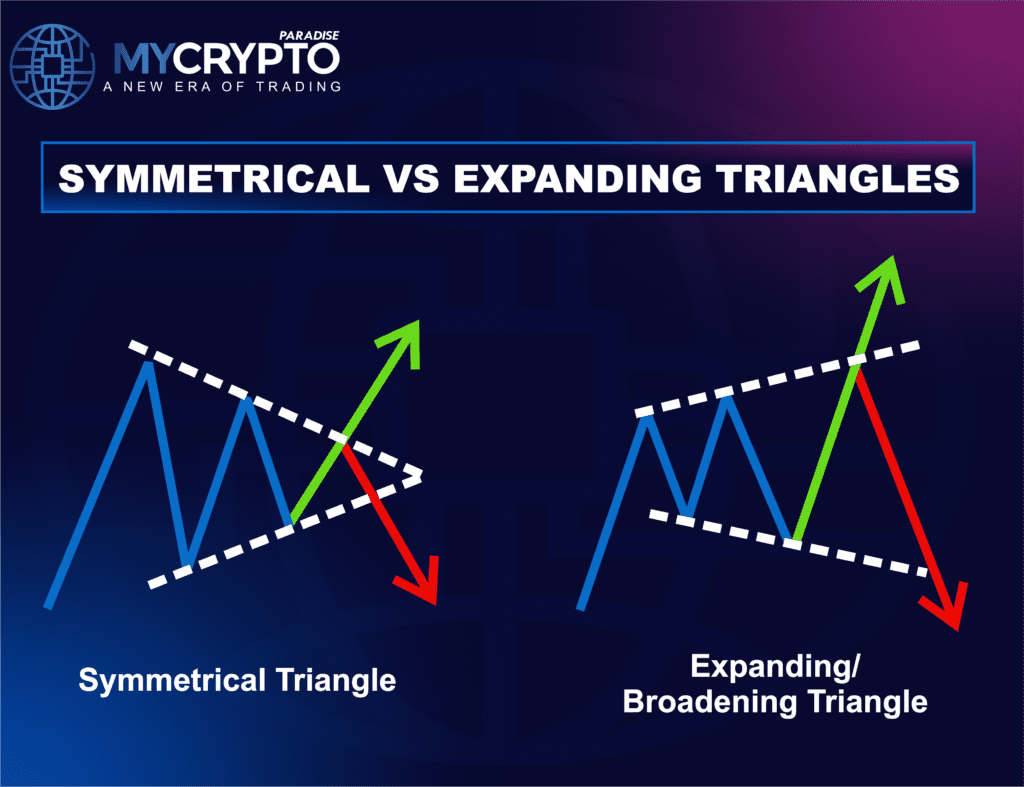
Symmetrical triangles show compression before a breakout, but expanding ones suggest things are getting unstable and messy.
Conclusion
The symmetrical triangle isn’t really about predicting exactly what the market will do. It’s more about noticing when the price is compressing and the market is pausing. Buyers and sellers keep pushing against each other in a pretty tight range, and usually you can tell that something’s starting to build underneath.
Sometimes the breakout turns into a strong trend that keeps going for several candles. Other times, it turns out to be a false move that quickly reverses. That’s just part of trading nothing works all the time.
At ParadiseFamilyVIP, we try to help traders put patterns together with market structure, keep an eye on liquidity, and handle risk as they go. Patterns by themselves don’t tell the full story. But when they show up in the right spots, they can point out chances that newer traders often miss.
The edge we look for is a repeatable process: the same checklist and the same risk per trade, every time.
Symmetrical triangle pattern FAQ
What is a symmetrical triangle pattern?
It is a technical chart pattern where price tightens between two converging trendlines, one connecting lower highs and one connecting higher lows. The compression reflects market indecision as buyers and sellers push against each other until one side gains control.
Is a symmetrical triangle bullish or bearish?
The pattern is generally considered neutral and can break either way. The surrounding context matters: a triangle inside an uptrend often resolves higher, while one inside a downtrend often resolves lower.
How reliable is the symmetrical triangle pattern?
In Thomas Bulkowski’s stock data, about 60% of breakouts go up, but that is a direction split, not a win rate. Only 58% of upward breaks reached the full measured target. False breakouts are common in crypto, so many traders wait for a close outside the pattern before acting.
How do you confirm a symmetrical triangle breakout?
Wait for a candle to close firmly outside the triangle rather than acting on a brief poke beyond a trendline. A pickup in volume as price exits the structure adds confidence that momentum is returning.
How do you set a price target from a symmetrical triangle?
Measure the height of the triangle at its widest point, from the first high to the first low. Add it to the breakout price for an upside target, or subtract it for a downside one. Treat the result as a rough guide: in Thomas Bulkowski’s stock data, only 58% of upward breakouts reached the full target.
How do you avoid false breakouts in a symmetrical triangle?
Watch for three warning signs: a break on falling volume, a close back inside the triangle, and a higher-timeframe trend pointing the other way. Many traders also want RSI or MACD to agree with the breakout direction. No filter removes false breakouts completely, so keep the stop in place.
Crypto trading involves substantial risk of loss. This article is educational and is not financial advice. Past performance does not guarantee future results. Always do your own research.
What is different here
Most guides stop at the theory. The MyCryptoParadise team shares the live trades, and the reasoning behind each one, inside ParadiseFamilyVIP. Everything here is education, not financial advice.
Crypto trading involves substantial risk and is not suitable for everyone. Nothing here is financial advice; it is education only. Never risk more than you can afford to lose.











Join the discussion
No comments yet. Members, share how you are reading this.