


Technical Analysis Patterns
In short
The Head and Shoulders pattern is a popular bearish reversal pattern in technical analysis, signaling a potential shift from an uptrend to a downtrend. It consists of three peaks: a left shoulder, a higher head, and a right shoulder, with the shoulders typically of similar height. This pattern helps traders identify potential trend reversals for informed buying or selling decisions.
The head and shoulders pattern is one of the most popular and widely used reversal patterns in technical analysis. This pattern is used to identify potential changes in the direction of a trend and can be used by traders and investors to make informed decisions about when to buy or sell a particular asset.
The pattern is made up of three parts: the left shoulder, the head, and the right shoulder. These three parts form a peak or top that resembles a human head and shoulders, hence the name. The left and right shoulders are usually of similar height, while the head is higher than both.
The head and shoulders pattern is a bearish reversal pattern, meaning that it occurs after an uptrend and signals a potential reversal to a downtrend. The pattern is considered to be a reliable indicator of a trend reversal when it appears after a sustained uptrend.
The left shoulder of the pattern is formed when an asset reaches a new high and then pulls back, forming a temporary low. The subsequent move higher creates the head of the pattern, which is characterized by higher volume and higher volatility. The right shoulder is formed when the asset again reaches a new high but fails to exceed the high of the head. This failure to make a new high is an important signal that the trend may be reversing.
Technical Methodology of the Pattern
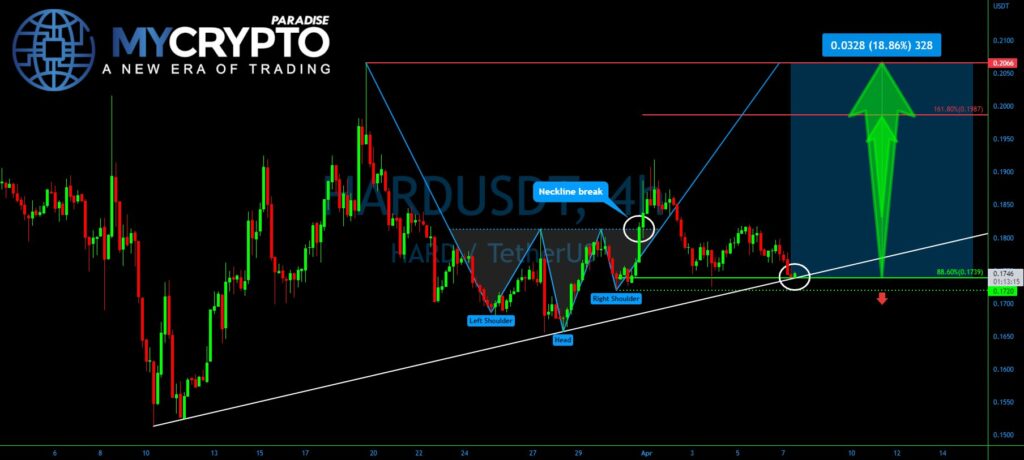
One of the key factors to watch for in a head and shoulders pattern is volume. Volume should be highest during the formation of the head of the pattern and then gradually decrease as the right shoulder is formed. This decrease in volume is a signal that the trend is losing momentum and that the bears are taking control.
In the HARD/USDT 4H timeframe chart above, traders who use the pattern typically look for a break below the neckline of the pattern to confirm the trend reversal. The neckline is drawn through the lows of the left and right shoulders at around $0.18 area and is used as a support level. A break below the neckline signals that the bears have taken control and that the asset is likely to continue moving lower.
Variations of the Head and Shoulders Pattern
There are several variations of the pattern, including the inverse head and shoulders pattern, which is a bullish reversal pattern that occurs after a downtrend. The inverse head and shoulders pattern is made up of three parts as well: the left and right shoulders, and the head. The two sides are usually of similar height, while the midpoint is lower than both shoulders.
The Inverse Head and Shoulders
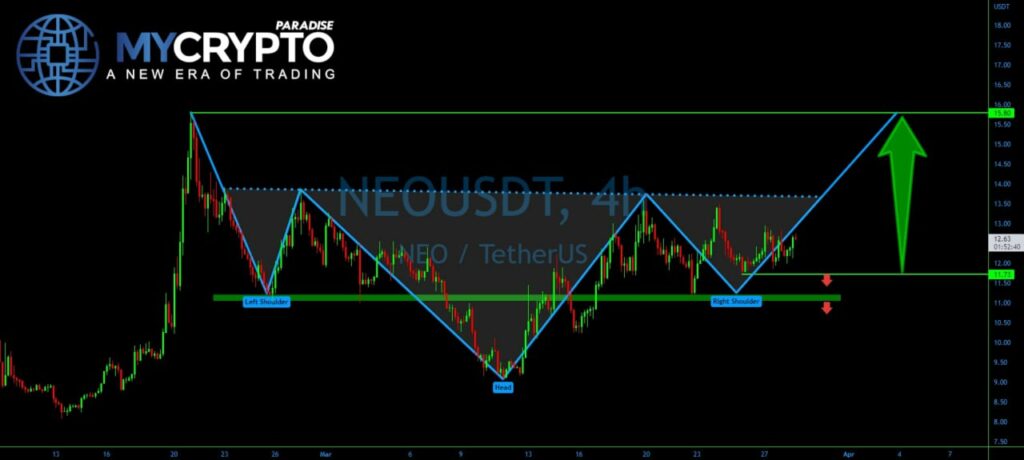
The inverse head and shoulders pattern forms when NEO/USDT price reaches a new low and then bounces back, forming a temporary high. The subsequent move lower creates the head of the pattern at the $9.0 marked area, which is characterized by higher volume and higher volatility. The right shoulder is formed when the asset again reaches a new low at around $11.0 mark but fails to exceed the low of the head. This failure to make a new low is an important signal that the trend may be reversing.
As with the head and shoulders pattern, volume is important to watch for in the inverse head and shoulders pattern. Volume should be highest during the formation of the head of the pattern. It should then gradually decrease as the right shoulder is formed. This decrease in volume is a signal that the trend is losing momentum and that the bulls are taking control.
On a similar note, traders who use the inverse style of the pattern typically look for a break above the neckline of the pattern to confirm a trend reversal. The neckline is drawn through the highs of the left and right shoulders and is used as a resistance level. A break above the neckline signals that the bulls have taken control. And, that, the asset is likely to continue moving higher.
Limitations of the Pattern
The head and shoulders pattern, and the inverse pattern are reliable indicators of trend reversals. However, they should not be used in isolation.
Traders should use other technical indicators and fundamental analysis to confirm the trend reversal. Also to identify potential entry and exit points.
Please note that the head and shoulders pattern is not always a perfect representation of a trend reversal. Sometimes, the shoulders may not be of equal height, or the head may not be significantly higher than the shoulders. In these cases, the pattern may not be as reliable as a signal of a trend reversal.
Another potential issue with using this pattern is the possibility of false signals. There may be instances where an asset appears to be forming a head and shoulders pattern, but it’s not. The pattern may not ultimately lead to a trend reversal. Traders should be cautious when using this pattern. They should always confirm the pattern with other technical indicators and fundamental analysis.
In spite of obvious issues, the pattern remains a popular and widely used tool in technical analysis. It proves a useful method to identify likely trend reversals. It can also be used in combination with other tools and techniques to make informed trading and investment decisions.
Conclusion
The head and shoulders pattern is a bearish reversal pattern. It is used to identify potential changes in the direction of a trend. The pattern is made up of three parts: the left and right shoulders, and the head. It is characterized by higher volume during the formation of the head. This volume decreases during the formation of the right shoulder. Traders typically look for a break below the neckline of the pattern to confirm the trend reversal. While the pattern is a useful tool in technical analysis, traders and investors should use other technical indicators and fundamental analysis to confirm the trend reversal and to identify potential entry and exit points.
Crypto trading involves substantial risk and is not suitable for everyone. Nothing here is financial advice; it is education only. Never risk more than you can afford to lose.


Join the discussion
No comments yet. Pro Paradiser members, share how you are reading this.