



Chart Patterns Explained
In short
A double top pattern is a bearish reversal pattern in technical analysis. It forms when an asset's price reaches a high, pulls back to a trough, then retests the same high before falling. Confirmation occurs when the price breaks below the trough level.
Crypto trading takes knowledge, skill and discipline. One pattern experienced traders use to spot a possible market top is the double top pattern. It is a close relative of the head and shoulders pattern. In this lesson, we explore advanced methods to identify, confirm and trade the double top in crypto.
What Is a Double Top Pattern and Why Does It Matter?
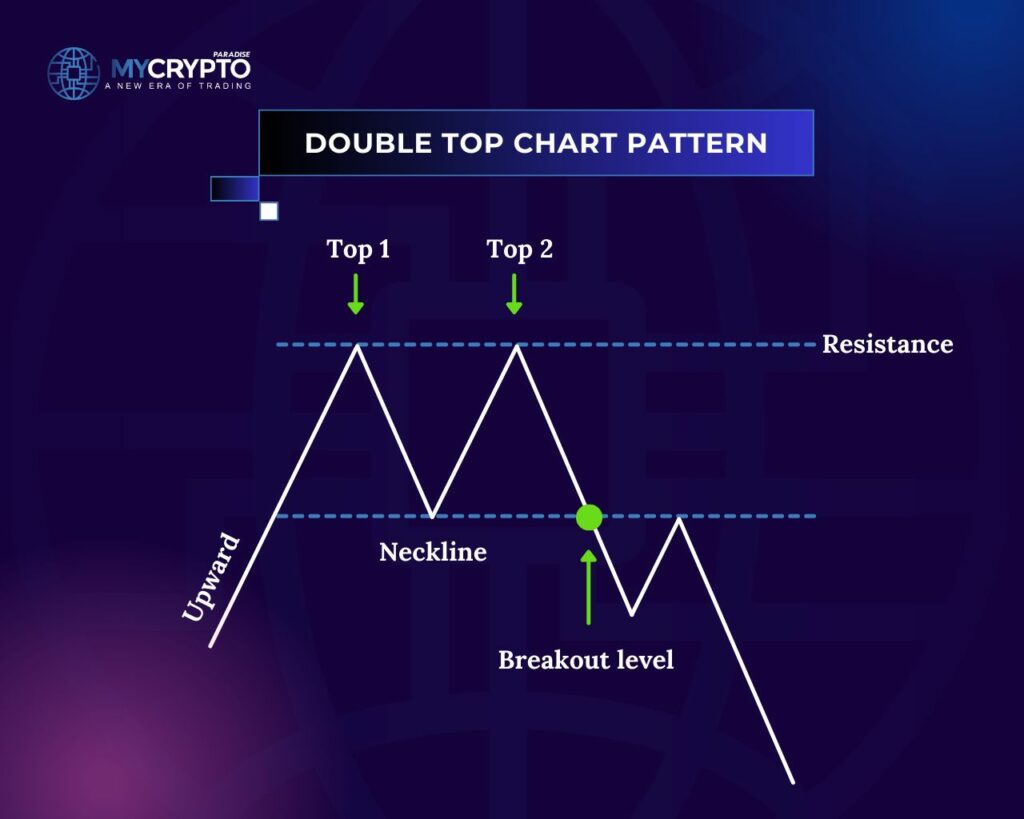
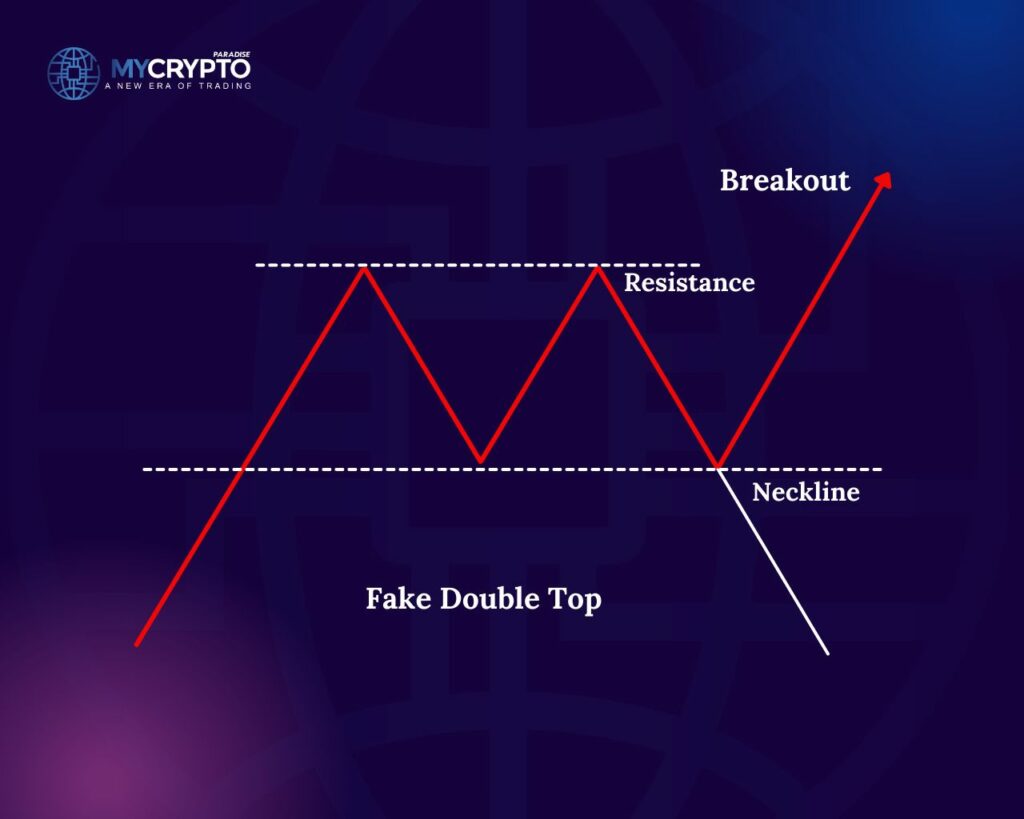
A double top pattern is a bearish reversal pattern that forms after an uptrend. Price reaches a high, pulls back to a trough, then climbs back to roughly the same high and fails there. The two peaks give the chart an M shape, and the trough between them is called the neckline.
The pattern matters because it shows buyers losing strength right where they failed before. In crypto, hype and volatility drive fast rallies, and those rallies can end just as fast. A double top helps you notice a possible top before the market turns, not after the drop has already happened.
Each failed push at the same resistance tells part of the story. The first rejection shows sellers waiting at that price. The second rejection, often on weaker volume, points to buyer exhaustion and early distribution. A close below the neckline, the support level between the two tops, turns the setup into a confirmed bearish reversal.
Key characteristics of a double top:
- It appears after a clear uptrend
- Two peaks form at nearly the same price, like the letter M
- The second peak often shows bearish divergence and fading momentum
- A close below the neckline confirms the bearish shift
How to Identify a Double Top Pattern
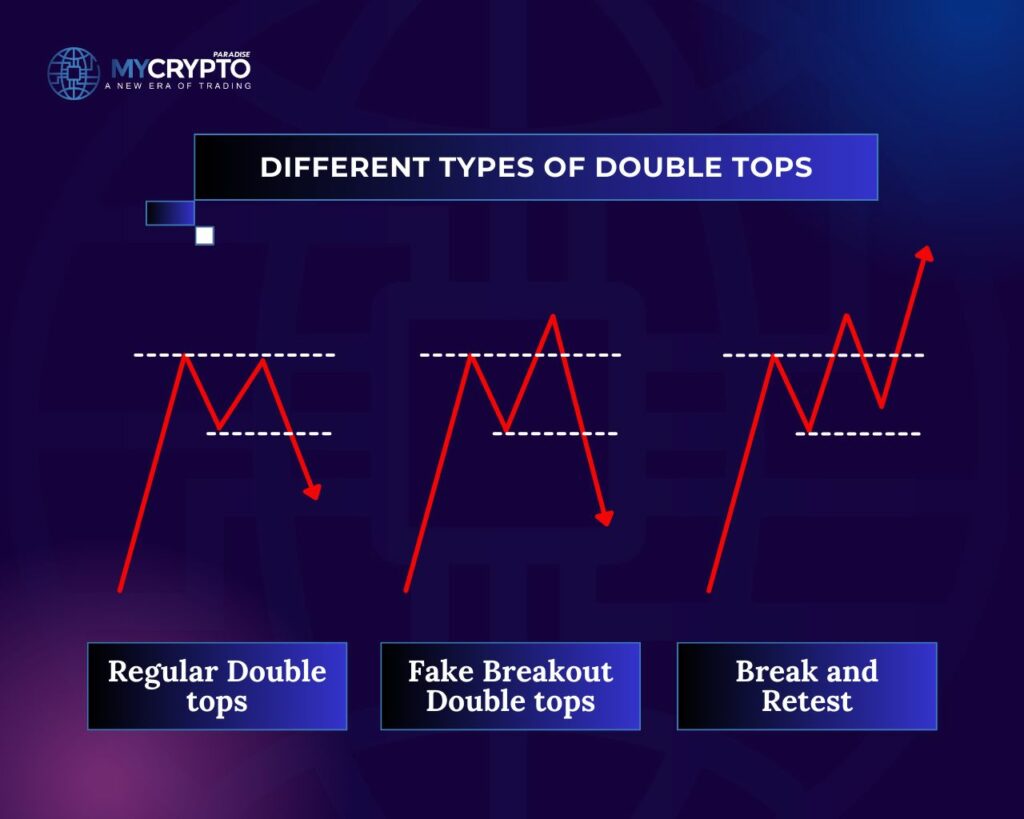
The double top pattern contains two peaks and one trough. The two peaks sit at roughly the same level. They usually form some time apart, so don’t rush to label a pattern. When the second peak forms almost straight after the first, you are most likely looking at a fake double top.
On higher timeframes, the gap between the peaks is often several weeks or even months. The final confirmation comes when price breaks below the trough and keeps falling. Until that break, two similar highs are only a possible double top, not a confirmed one. The five stages below show how the pattern builds.
Step 1: The First Top
The pattern starts with a strong bullish impulse, often with rising volume and large candle bodies. This leg prints the first high, Top 1. That high becomes the resistance level that later defines the reversal zone.
The first top is not a reversal yet. It only sets the cap. Momentum starts to slow near it, and common signs include:
- Long upper wicks
- Volume fading at the high
- An overbought relative strength index (RSI) reading above 70
- Failed candle closes above the swing high
Step 2: The Pullback and the Neckline
After the first rejection, price pulls back in a fairly orderly way and forms a trough. The low of that trough becomes the neckline. It is more than a line on the chart. It is the support that decides whether the uptrend can continue.
The neckline often lines up with a local demand zone, a previous breakout level or the middle of the last impulse candles. Volume usually fades during the pullback. That shows hesitation and a pause, not panic selling.
Step 3: The Second Top
Of the five steps, the second top carries the most information. Price bounces off the neckline and rallies again, but it fails to break or close clearly above the first top. The height looks similar, yet the move lacks conviction. Watch for these warning signs:
- Lower volume than at the first top
- Momentum divergence on RSI, MACD (moving average convergence divergence) or on-balance volume (OBV)
- Shrinking candle bodies and long upper wicks near the old high

From the outside, the second push looks like strength. Underneath, it is a failed attempt to continue the trend.
Step 4: The Neckline Test
After the second rejection, price drops back toward the neckline. Many crypto traders misread this move and treat the neckline as just another bounce zone. At this stage, watch how price behaves around the line:
- The drop often speeds up on rising volume
- Tight consolidation just above the neckline can show selling pressure building
- A break on low volume raises the risk of a fakeout
Real breakdowns usually come with a clean candle close below the neckline. A brief retest of the line from below often follows.
Step 5: The Breakdown
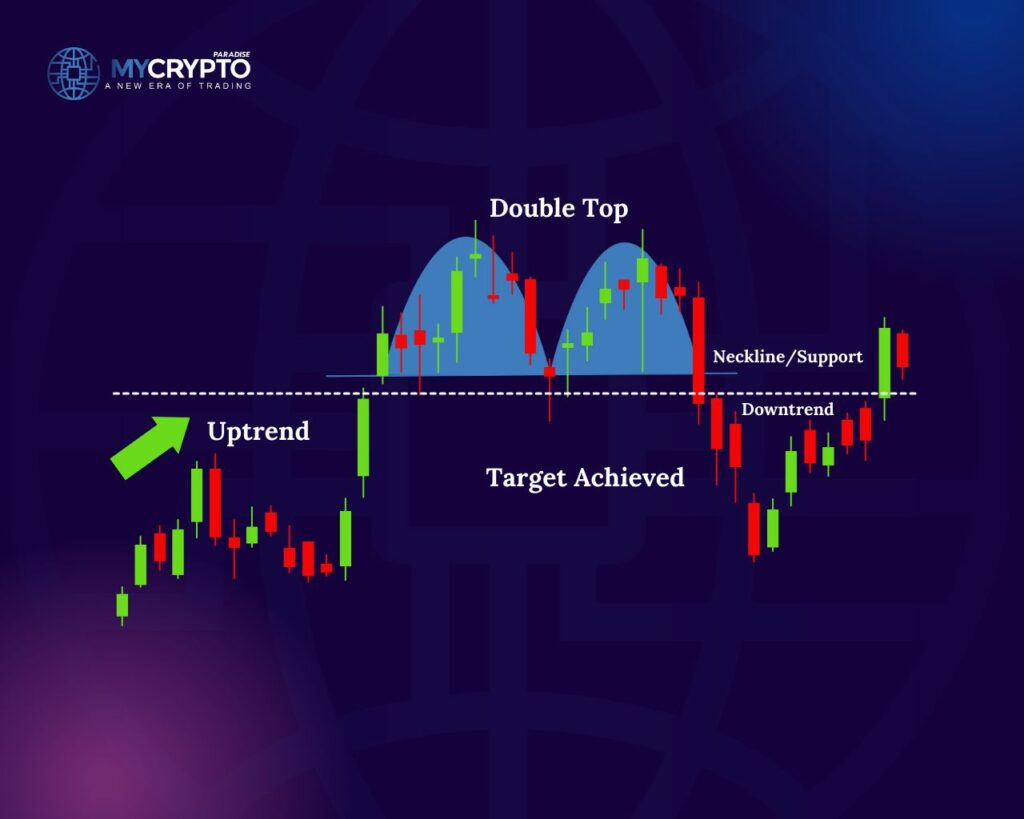
In the final step, a candle closes firmly below the neckline, ideally while sell volume rises. A wide-range candle with a volume spike is the cleanest version. This close confirms the double top and opens the way for a measured move lower.
Advanced Methods to Trade the Double Top Pattern
Once a double top pattern has been identified, traders use several advanced methods to trade it in the crypto market. These methods include:
1. Short selling: Short selling lets a trader aim to gain from a falling price. The conservative short comes after the close below the neckline. Shorting at the second peak comes earlier and carries more risk, because the pattern is not confirmed yet. Either way, a stop-loss order limits the loss if price keeps rising.
2. Fibonacci retracement: This tool marks possible support and resistance levels. Draw it over the rally that built the pattern, from its swing low to the peak. Once the neckline breaks, the retracement levels below it can serve as staged exit points.
3. Moving average convergence divergence (MACD): The MACD indicator tracks momentum and helps spot possible trend reversals. With a double top, look for a bearish crossover of the MACD line below the signal line near the second peak. It shows that momentum is shifting to the downside.
4. Volume analysis: Volume helps confirm that the pattern is real. Volume is often lighter on the second peak than on the first, which shows fading demand. A clear jump in volume on the neckline break adds weight to the signal.
5. Price action analysis: Price action focuses on how price itself behaves, not on indicators. Look for signs of weakness, such as a failure to break resistance or a run of lower highs and lower lows after the break.
How to set stop loss and take profit with double top pattern
Plan the entry, the stop loss and the take-profit level before you open a double top trade. The stop limits the loss if the pattern fails. The take-profit order closes the trade at a planned level if it works.
Entry: Wait for the Close Below the Neckline
In a valid double top, the second peak rallies back into the same resistance zone with less strength. It often prints lower volume and momentum divergence on RSI or MACD. That weakness is a warning, not yet an entry signal.
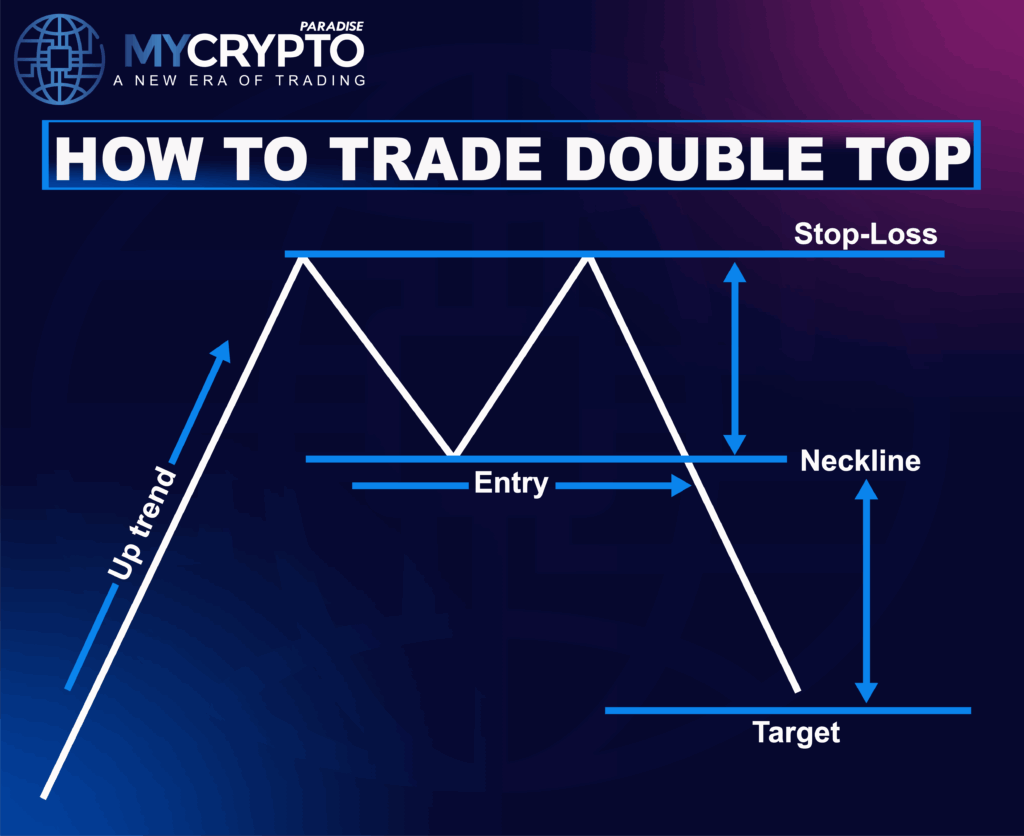
The standard entry comes after a candle closes below the neckline. A rise in volume on that close shows that buyers have lost control. A more patient entry waits for price to retest the broken neckline from below, then enters as the retest fails.
Stop Loss: Where the Pattern Is Proven Wrong
The standard stop loss sits just above the second peak. Sellers turned price down at that high, so the whole bearish case rests on it holding. If price breaks back above it and stays there, the double top is invalid and the trade should close.
Some traders place a tighter stop just above the broken neckline. It cuts the risk per trade, but retests hit it more often. Whichever level you use, add a small buffer, because crypto wicks often sweep obvious highs before price turns.
Take Profit: The Measured Move
To set the target, measure the height from the top to the neckline. Then project that same distance down from the breakdown point. This measured move gives a target that follows the pattern’s own structure.
Worked example: a coin tops out twice near $1.00, and the neckline sits at $0.90. The height is $0.10, so the measured target is near $0.80. The standard stop goes a little above $1.00.
The measured move is a base target, not a promise. Some traders close part of the position there and let the rest run toward 1.5 to 2 times the pattern height. The deeper target is reached less often, so size that part with care.
Three habits help while the trade is open:
- Check other indicators: moving averages and oscillators show whether the drop has strength behind it.
- Adjust as the market moves: if price falls fast, trail the stop lower to protect the open gain.
- Put risk first: size the position from the stop distance, never from the target.
How to Set Position Size on a Double Top Trade
As with the triple top pattern, position size is a key part of trading the double top. It is the amount of capital you put into one trade. Follow these steps to set it.
1. Set the risk per trade: This is the amount you accept to lose if the stop is hit. A common rule is to risk no more than 1 to 2% of the account on any single trade. With a $10,000 account, that is $100 to $200.
2. Measure the stop distance: This is the gap between the entry price and the stop-loss price. In the example above, a short at $0.89 just under the neckline with a stop at $1.02 has a stop distance of $0.13 per coin.
3. Calculate the position size: Divide the risk per trade by the stop distance.
Position size = risk per trade / distance from entry to stop loss
With $100 of risk and a $0.13 stop distance, the position is about 769 coins, worth roughly $684 at entry. If the stop is hit, the planned loss is about $100, or 1% of the account, before fees and slippage.
4. Check the reward-to-risk ratio: The measured target at $0.80 sits $0.09 below that entry, less than the $0.13 at risk. Below 1:1, many traders skip the trade or wait for a retest. A retest entry near $0.90, with a stop at $0.93 above the retest high, risks $0.03 against a $0.10 move.
5. Adjust for the pattern and the market: Give more weight to double tops that form over weeks or months. A pattern built in only a few days is less reliable, so trade it smaller or skip it. Whatever the volume, never go above your risk per trade. Also account for volatility and your risk tolerance.
Common Mistakes Traders Make When Trading With Double Top Pattern
Even a correct double top can fail through poor execution. Below are the errors that most often spoil the trade, and the fix for each.
1. Misreading the structure: Not every pair of highs is a double top. A valid pattern needs a prior uptrend and two distinct, near-equal peaks with a visible pullback between them. If the second top is clearly higher, or no trend came before it, the setup is weak. Check the bigger picture before acting.
2. Entering too early: Many traders see two peaks and assume the pattern is complete, only to watch price keep rising. Without a neckline break, a possible double top may just be a bullish consolidation. Wait for the close below the neckline. One extra candle of confirmation costs far less than a full invalidation.
3. Placing the stop too tight: Crypto is volatile, and wicks often sweep the second peak before price rolls over. A stop placed exactly at that high is often hit too early. Set it a little above the second top, with a buffer based on ATR (average true range) or recent swing wicks.
4. Ignoring the bigger trend: The double top signals a possible shift from bullish to bearish. If the higher-timeframe trend is still strongly bullish, the pattern can fail and the uptrend can continue. Be more careful with counter-trend setups.
5. Relying on the pattern alone: The double top is one tool, not a certainty. Treat it as a probability signal and check moving averages, oscillators, news and market sentiment before you act on it.
6. Poor risk management: Trading always involves risk. Without stop-loss orders and sensible position sizes, one failed pattern can cause a large loss.
Conclusion
The double top pattern is a useful tool for crypto traders because it marks the point where buyers fail twice at the same level. Trade it only after the neckline breaks. Set the stop above the second peak, size the position from that stop and stay ready to adjust as conditions change.
The technical knowledge in this lesson gives you an edge, but a chart pattern alone is not a trading plan. It works best inside a clear strategy with strict risk management.
At ParadiseFamilyVIP, we combine technical analysis, on-chain data, sentiment tracking, and whale psychology to deliver carefully analyzed crypto signals and portfolio management strategies built around disciplined risk management.
The ParadiseTeam shares every trade we enter, along with planned exits and portfolio allocations, so you can see the reasoning behind each one.
We provide full transparency by sharing our daily trading activities with our own capital, giving you the opportunity to learn how professionals trade. If you’re ready to take your trading to the PRO level, joining our inner circle is the best way forward. Seats are limited, so join the waiting list if necessary.
This premium service is designed for traders with sufficient capital. For those starting out, we recommend using our FREE Telegram channels to build your foundation.
To check ParadiseFamilyVIP membership availability, click here: https://mycryptoparadise.com/paradisefamilyvip/
We exclusively trade on vetted exchanges that provide up to 35% fee discounts and deposit bonuses for members. These platforms are trusted and secure, carefully selected by the ParadiseTeam 💙🌴
MEXC: https://www.mexc.com/acquisition/custom-sign-up?shareCode=mexc-FeesLowered
BINGX: https://bingx.com/invite/VY6MB8BAX/
KCEX: https://www.kcex.com/register?inviteCode=PARADISEFAMILYVIP
BITUNIX: https://www.bitunix.com/register?vipCode=ParadiseFamilyVIP
Double Top Pattern FAQ
What confirms a double top pattern?
Confirmation occurs when price breaks below the trough (neckline) that sits between the two peaks. Until that break happens, the two peaks alone are not enough, and entering early is a common mistake. A volume increase on the break adds further validity.
Where do you set the stop loss on a double top?
The standard stop sits just above the second peak, with a small buffer for crypto wicks. If price closes back above that peak, the pattern has failed. A tighter stop just above the broken neckline limits the risk per trade, but retests hit it more often.
How do you calculate the profit target?
Measure the vertical distance between the peaks and the trough, then project that distance downward from the breakdown point. That measured move is the base target. Some traders let part of the position run toward 1.5 to 2 times the distance, but that deeper target is reached less often.
How much should you risk per double top trade?
A common rule is to risk no more than 1 to 2 percent of your account balance on any single trade. On a $10,000 account that is $100 to $200. Position size then follows from that amount divided by the distance between the entry and the stop loss.
What signals weakness at the second peak?
Look for three warning signs at the second high. Volume is usually lighter than it was at the first top. RSI, MACD or on-balance volume (OBV) prints a lower high while price stalls near the old peak. Small candle bodies and long upper wicks show buyers failing to break resistance.
Crypto trading involves substantial risk of loss. This article is educational and is not financial advice. Past performance does not guarantee future results. Always do your own research.
What is different here
Most guides stop at the theory. The MyCryptoParadise team shares the live trades, and the reasoning behind each one, inside ParadiseFamilyVIP. Everything here is education, not financial advice.
Crypto trading involves substantial risk and is not suitable for everyone. Nothing here is financial advice; it is education only. Never risk more than you can afford to lose.












Join the discussion
No comments yet. Members, share how you are reading this.