


Technical Analysis Patterns
In short
The Inverse Head and Shoulders pattern is a technical analysis chart formation indicating a potential trend reversal from a downtrend to an uptrend. It is characterized by three low points: a central, lowest point (the head) and two higher, roughly equal low points on either side (the shoulders), resembling an upside-down head and shoulders.
The inverse head and shoulders pattern is popular among other technical indicators that crypto traders use. Even new traders can easily identify and apply its techniques for profitable trading. It can easily help traders identify a possible change in the current trend.
This pattern characterizes three low points, with the middle point being the lowest and the two outer points forming the “shoulders.” The middle point is refers to the “head,” and the pattern resembles a head and shoulders turned upside down.
In this article, we will discuss the Inverse Head and Shoulders pattern, how to identify it, and how traders use it to make trading decisions.
Identifying the Inverse Head and Shoulders Pattern

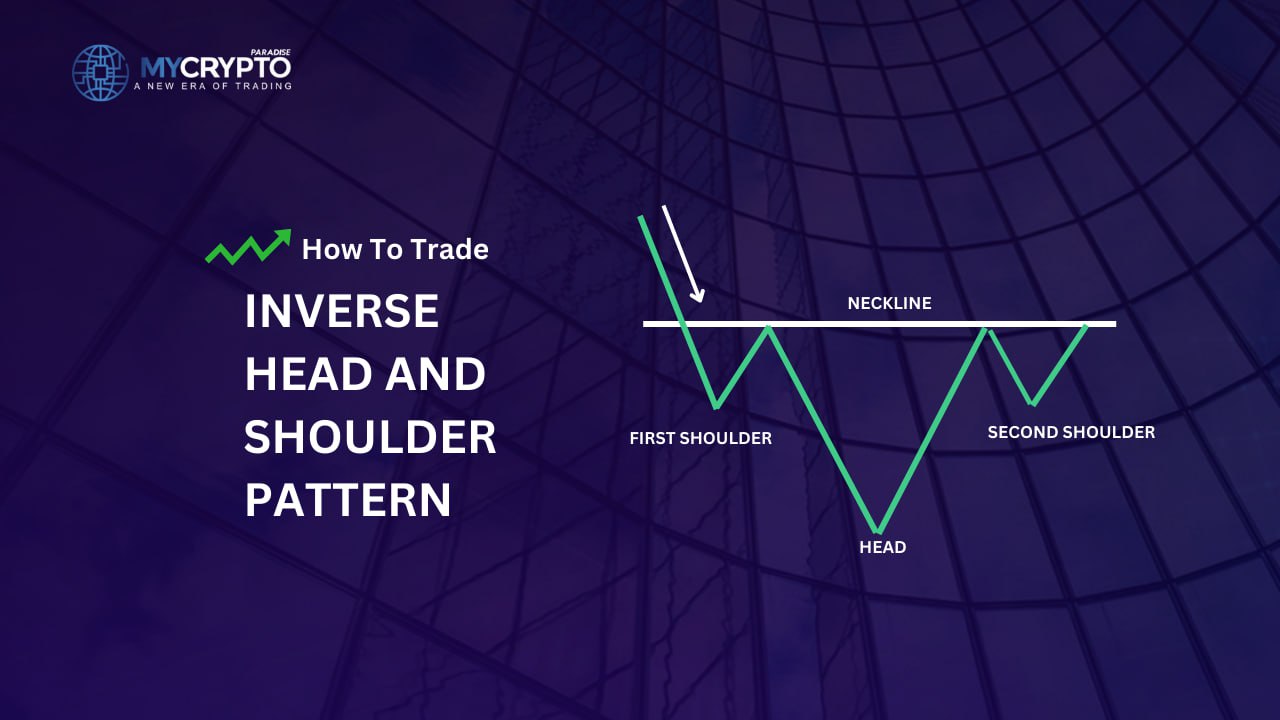
To identify the Inverse Head and Shoulders pattern, traders look for three key points on a price chart. The first “shoulder” forms when the price reaches a low point, followed by a rise in price to a higher point, forming the “head.” The second “shoulder” forms when the price falls again to a low point, followed by another rise in price to a point that is lower than the head.
The two “shoulders” should be roughly equal in height, and the head should be lower than both. The pattern is incomplete without having a neckline which traders use to connect the two shoulders. The neckline acts as a support level for the price, and a break above the neckline is acts as a bullish signal.
Trading with head and shoulders pattern
The pattern is good as a signal to enter long positions. When traders spot a formation, additional confirmation with other technical indicators usually help decision-making.
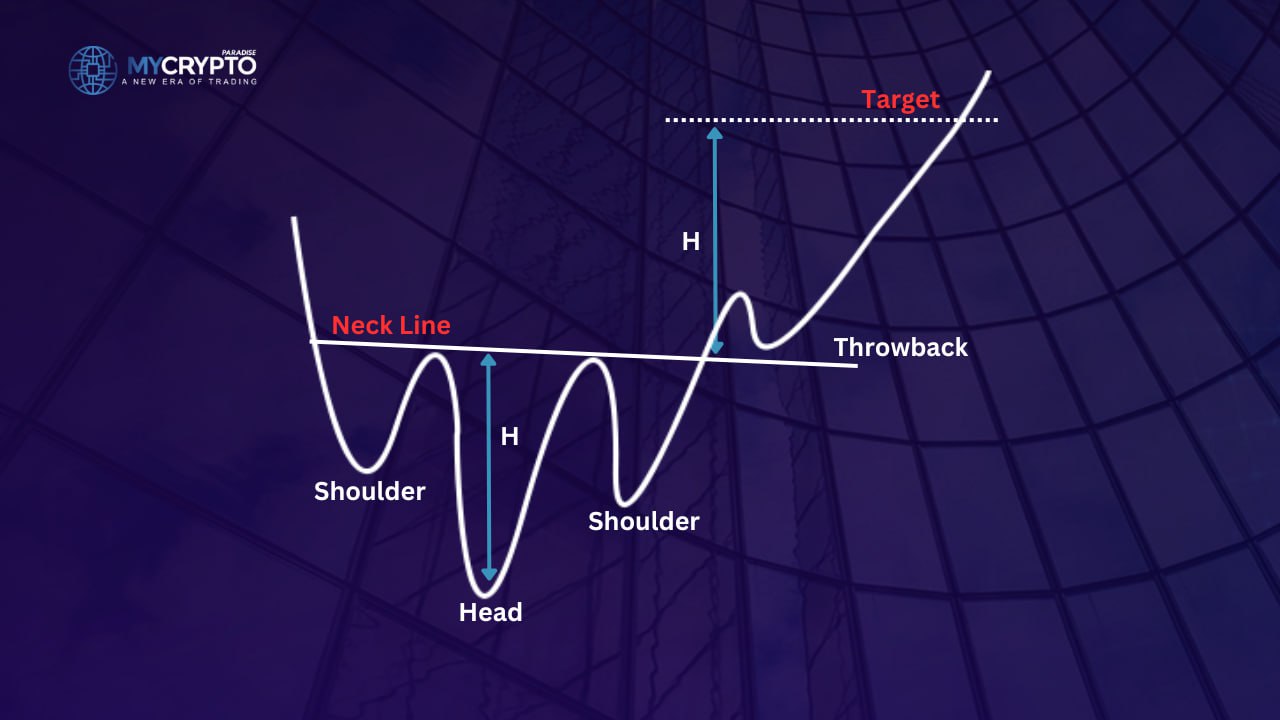
You should wait for the price to break above the neckline, indicating that the trend is reversing and a new uptrend is starting.
Once the price of the asset moves across (and stays above) the neckline, traders buy long positions. The stop loss of such trades is usually below the same neckline. The target where traders take profit is directly proportional to the height of the pattern. The distance is the length from the neckline to the head. This distance projects upwards from the breakout point, providing a target price for the trade.
Limitations of the Inverse Head and Shoulders Pattern
The inverse head and shoulders pattern has evident limitations. These limit traders from making trading decisions solely based on the pattern. The pattern works on the basis of price history, which may or may not repeat itself. Historical record of price is not a guarantee that the current price action will behave in the same way. Experienced traders make use of other indicators in combination with this pattern for trade confirmation.
Furthermore, the pattern can be difficult to identify, and traders may disagree on whether a pattern exists or not. There are sometimes false breakouts where price goes above the neckline of the pattern. Seldom, these breakouts are not genuine. The price may fall back below just after you enter a long position. This is another reason to not take the inverse head and shoulder as foolproof.
Conclusion
Crypto traders can make a lot of gains while following signals given by the inverse head and shoulders pattern. They are able to identify price shifts and trend changes within a period and make informed trading decisions.
Traders identify the pattern by looking for three low points, with the middle point being the lowest and the two outer points forming the “shoulders.” Once traders identify the pattern, they draw a “neckline” connecting the two “shoulders,” and wait for the price to break above the neckline before entering a long position.
Crypto trading involves substantial risk and is not suitable for everyone. Nothing here is financial advice; it is education only. Never risk more than you can afford to lose.


Join the discussion
No comments yet. Pro Paradiser members, share how you are reading this.