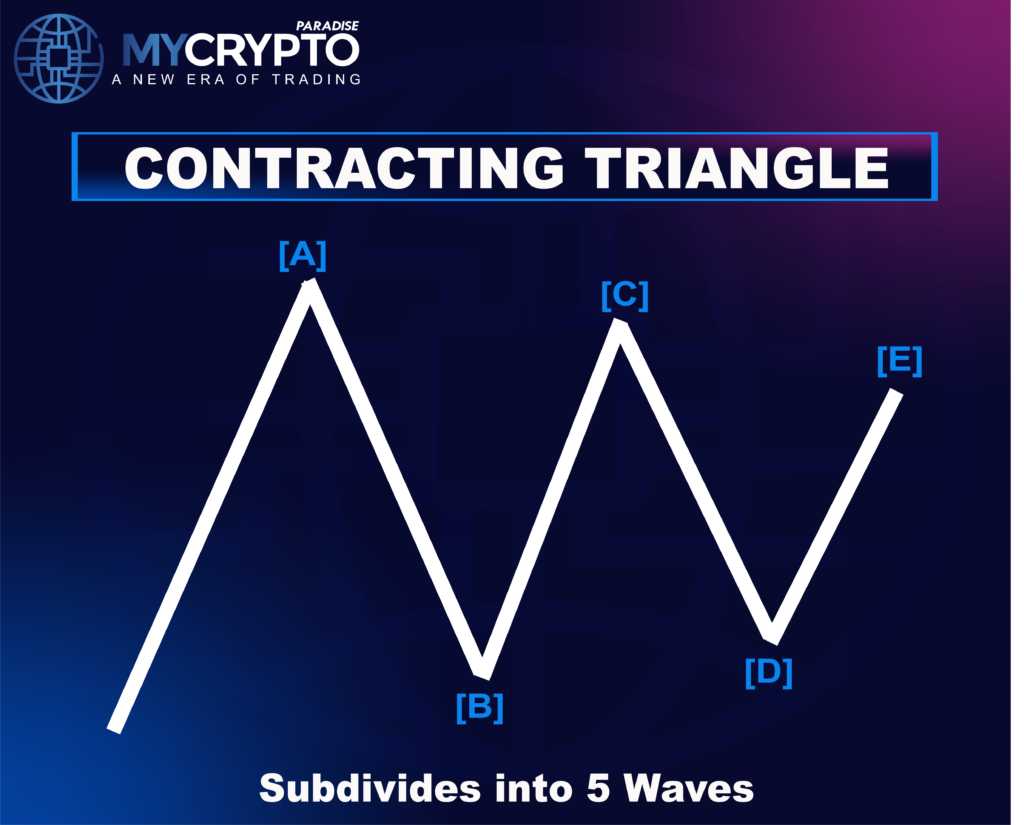
- A Contracting Triangle Correction is a five-wave pattern (A-B-C-D-E) that forms in a corrective pattern.
- The structure usually appears in wave 4 of an impulse or wave B of a zigzag.
- Spotting a Contracting Triangle early allows traders to prepare for the breakout move, which often comes sharply in the direction of the previous trend.
In the realm of Elliott Wave Theory, Contracting Triangle Correction represents one of the most reliable and insightful corrective patterns. In general, triangle correction structures appear when the market is taking a breather, before continuing in the main direction.
Unlike sharper corrections such as zigzags, the contracting triangle doesn’t aim to retrace deeply into the previous move. Instead, it stretches the correction sideways. In this article, we’ll explore its structure, rules, and how to spot and trade it effectively so that you can navigate sideways markets with more clarity.
What are Triangles
In Elliott Wave Theory, triangles are a special type of corrective pattern made up of five sub-waves labeled A, B, C, D, and E. These patterns are commonly seen during market consolidations when price pauses before continuing in its original direction.
Types of Triangles
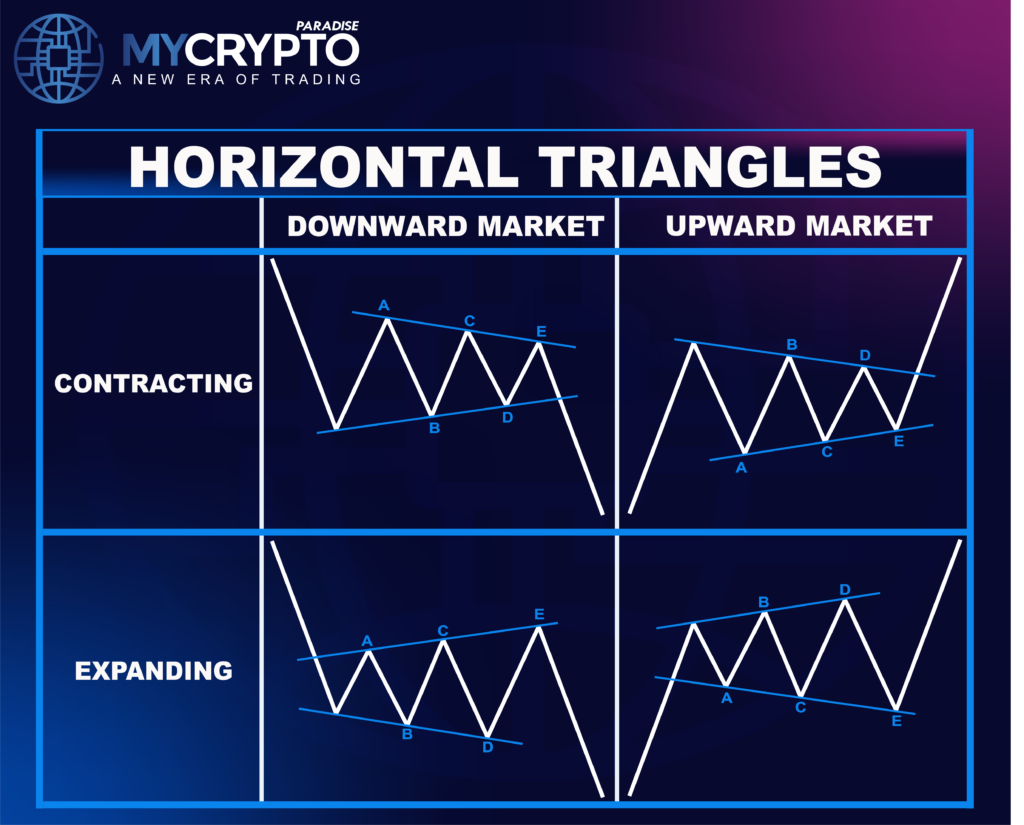
Triangles are divided into two main categories based on the slope of their generating lines:
- Horizontal Triangles
- Skewed Triangles
In this article, we will focus on one common type of horizontal triangle, the Contracting Triangle.
What is a Contracting Triangle Correction?
A Contracting Triangle Correction is a sideways pattern in Elliott Wave Theory comprising five waves: A, B, C, D, and E. It forms when the market pauses to consolidate before continuing its previous trend. Instead of sharp or deep pullbacks, this correction develops gradually and tightens over time, with each wave getting smaller than the last.
This pattern doesn’t aim to reverse the trend. It simply stretches the correction sideways, giving the market time to breathe. What may seem like indecision or noise on the chart is a structured pause. Recognizing this can help traders anticipate a continuation move once the pattern completes
Wave Structure of a Contracting Triangle

All five waves are corrective in nature and follow this internal layout:
- Wave A: Corrective.
- Wave B: Corrective.
- Wave C: Corrective.
- Wave D: Corrective.
- Wave E: Corrective.
All five waves progressively reduce in size, tightening the overall pattern and preparing the market for the next strong move.
How the Triangle Takes Shape
A Contracting Triangle gets its shape from two key lines: the top line connecting the highs, and the bottom line connecting the lows. These are called generating lines. They’re not random. Each wave (A, B, C, D, and E) respects and touches these lines, bouncing between them.
These lines converge as the pattern progresses, giving the triangle its tightening, wedge-like shape. The space between price swings gets narrower with each wave. That’s the “contracting” part.
Horizontal Contracting Triangle
A Horizontal Contracting Triangle is a variation where one of the generating lines, either the top or the bottom, is flat instead of sloped. While the triangle still contracts overall, this version looks a bit different on the chart.
- If the top line is flat and the bottom line slopes up, the structure is still valid.
- If the bottom line is flat and the top line slopes down, that works too.
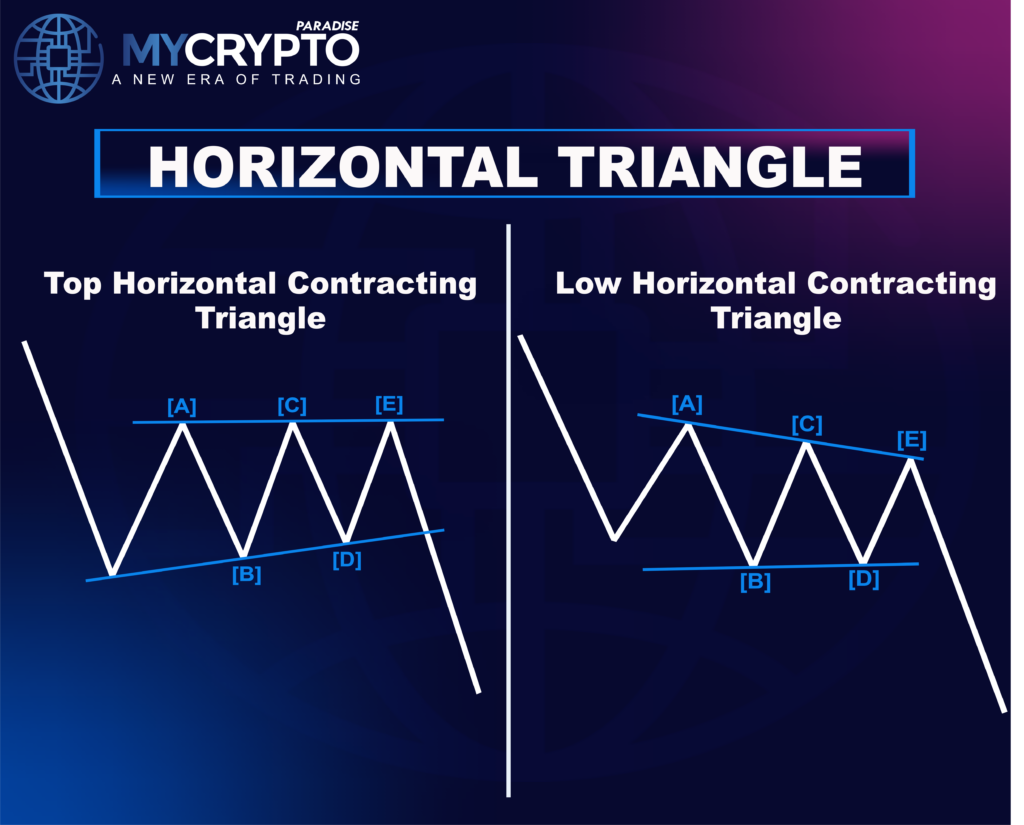
As long as price movement visibly contracts and the five-wave sequence is present, it’s still a legitimate triangle. Don’t mistake a flat line for a broken pattern, it’s often just a horizontal variation of the same setup.
Why is Contracting Triangle Correction Important?
Contracting triangles are significant because they are easily identifiable and often signal a high-probability trading opportunity. Once the triangle completes its E wave, the market usually continues in the same direction it was moving before the triangle began. This makes contracting triangles particularly valuable in trend continuation strategies.
Where Does the Contracting Triangle Appear?
A contracting triangle often shows up during pauses in the market before a final move in the dominant trend. It’s most commonly seen toward the end of a correction, signaling that the trend is preparing to resume.
- Wave 4 of an Impulse: Acts as a sideways correction before the fifth and final wave.
- Wave B of a Zigzag: Helps extend the correction before Wave C completes the pattern.
- Wave X or XX: Seen in complex corrections like Double and Triple Threes.
- Final Wave of Complex Patterns: Can mark the end of a corrective structure, including triangle patterns themselves.
By identifying these areas, crypto traders can better anticipate the triangle’s breakout direction and avoid misinterpreting sideways price action as a reversal.
Rules of Contracting Triangle
Let’s see the rules of the Contracting Triangle:
Five-Wave Structure
A contracting triangle is always composed of five sub-waves, labeled A-B-C-D-E. Each of these waves is corrective in form, meaning none of them are impulsive. This structure reflects a sideways price movement rather than a sharp retracement.
All Waves Are Corrective
Every wave inside a Contracting Triangle develops in a corrective mode (C-C-C-C-C). You will mostly see long sideways movements with contracting price action.
Wave B Can Be Any Size
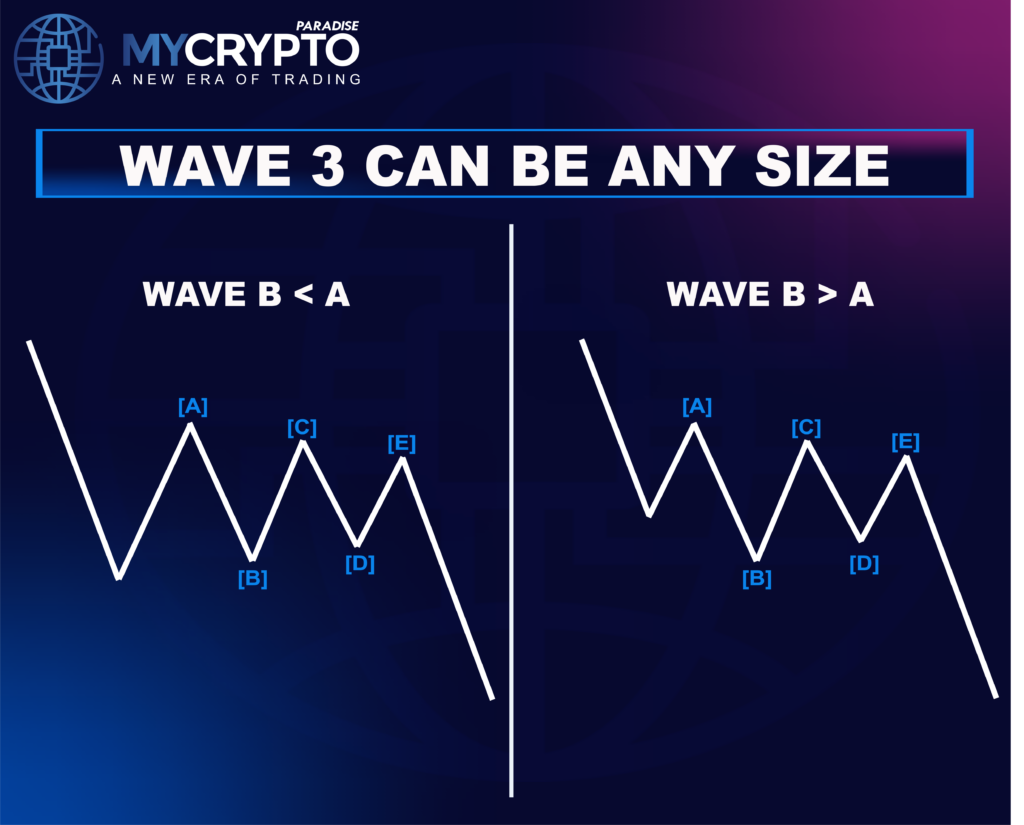
Wave B may sometimes be longer or shorter than wave A, and both variations are valid. This flexibility doesn’t break the triangle’s integrity as long as the overall pattern continues to contract. The critical factor is that wave B stays within the boundary of the converging structure and supports the triangle’s visual wedge formation.
Wave C Is Shorter Than Wave B
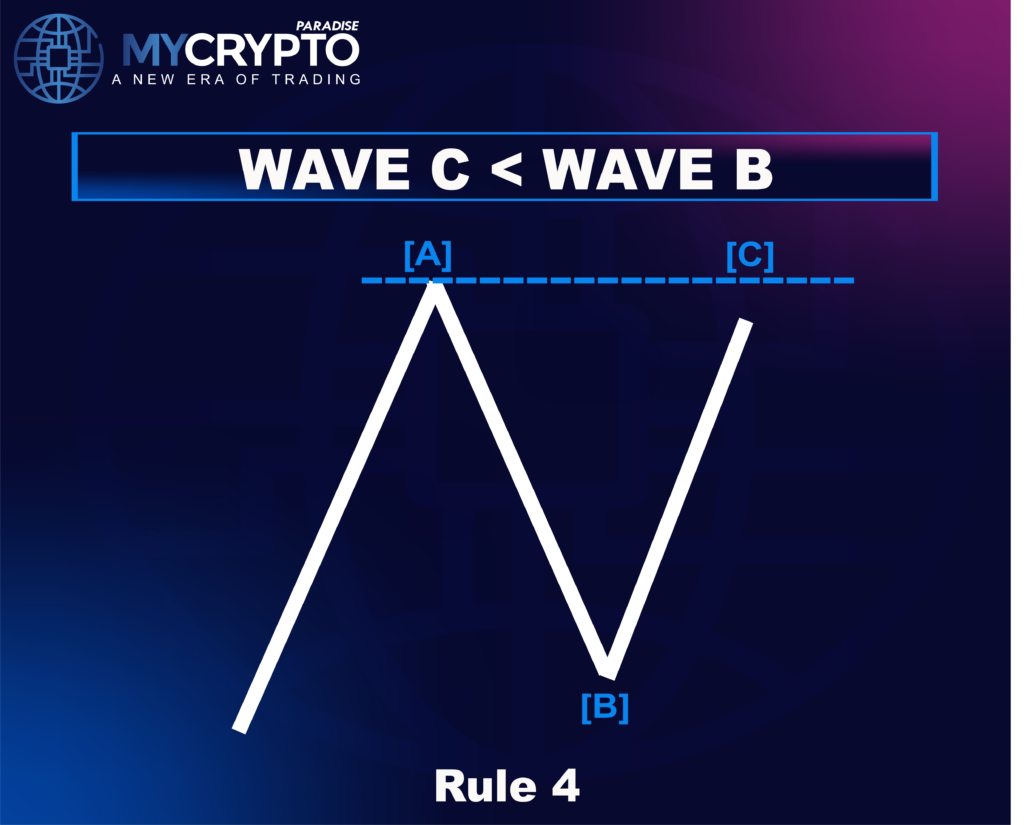
Wave C must not exceed the end of wave B. It should stay confined within the narrowing structure created by the previous waves. If wave C breaks beyond wave B’s boundary, it would signal a failure of the contracting triangle and invalidate the pattern.
Wave D Contracts Further
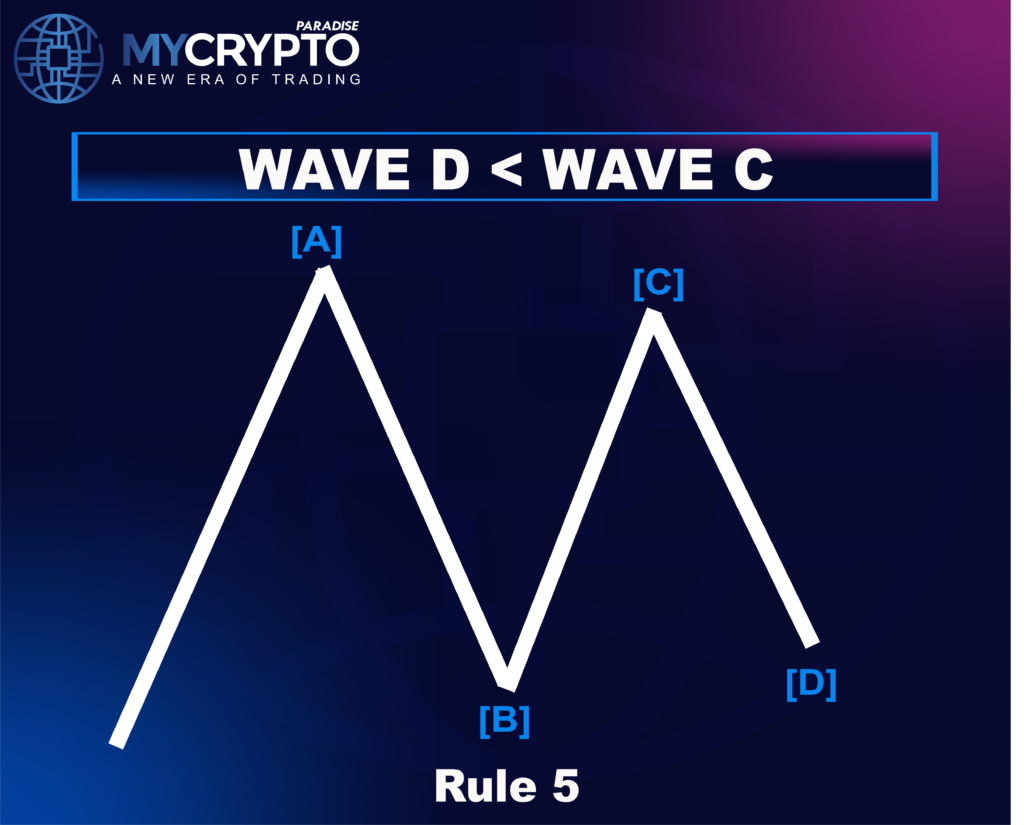
Wave D continues the pattern’s contraction by being shorter than wave C and staying within its high or low. It must not break the limits established by wave C.
Wave E Is the Final and Smallest
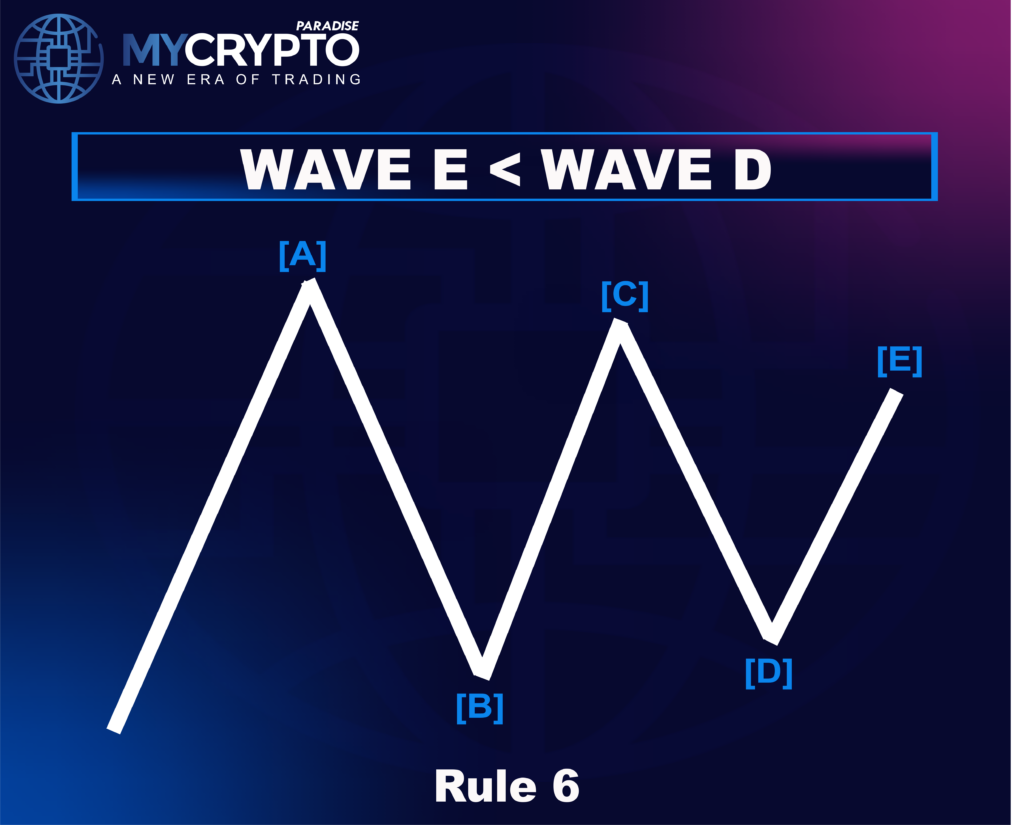
Wave E is the last and usually the shortest wave in the sequence. It wraps up the triangle by staying within the bounds of wave D. Once wave E is complete, the pattern is considered ready for a breakout, typically in the direction of the original trend before the triangle.
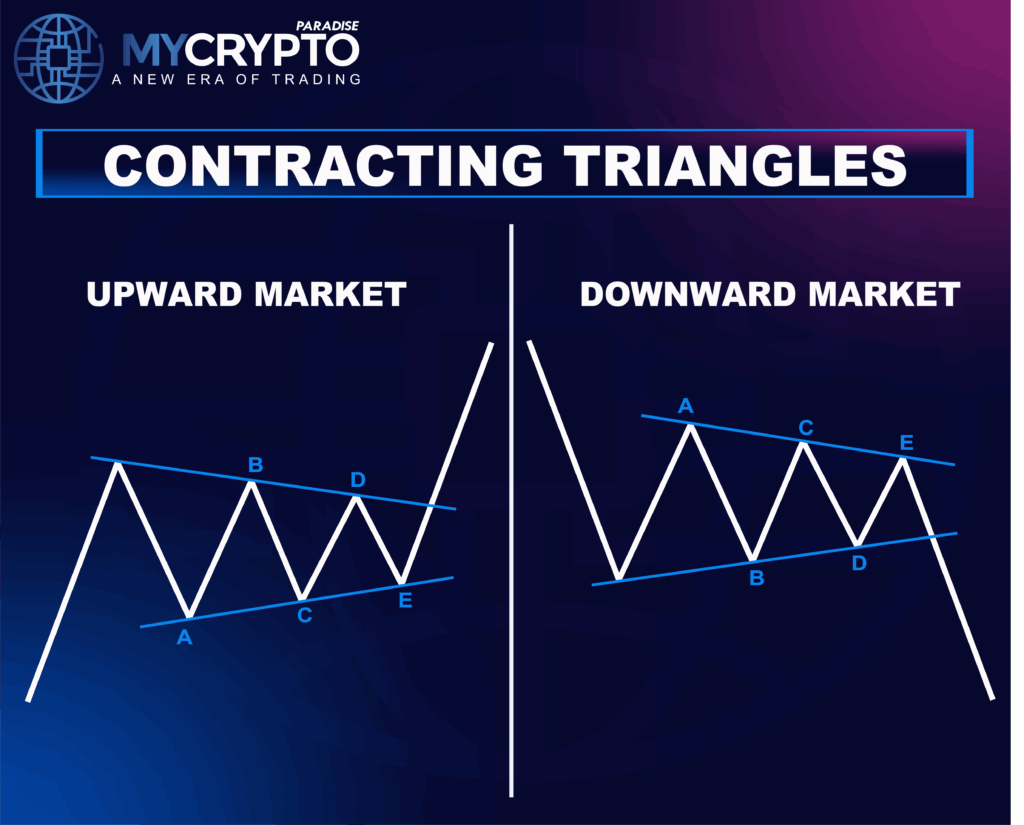
Bearish Contracting Triangle
A Bearish Contracting Triangle is a corrective pattern in Elliott Wave Theory that typically forms during a downtrend, signaling a temporary consolidation before the market resumes its downward movement.
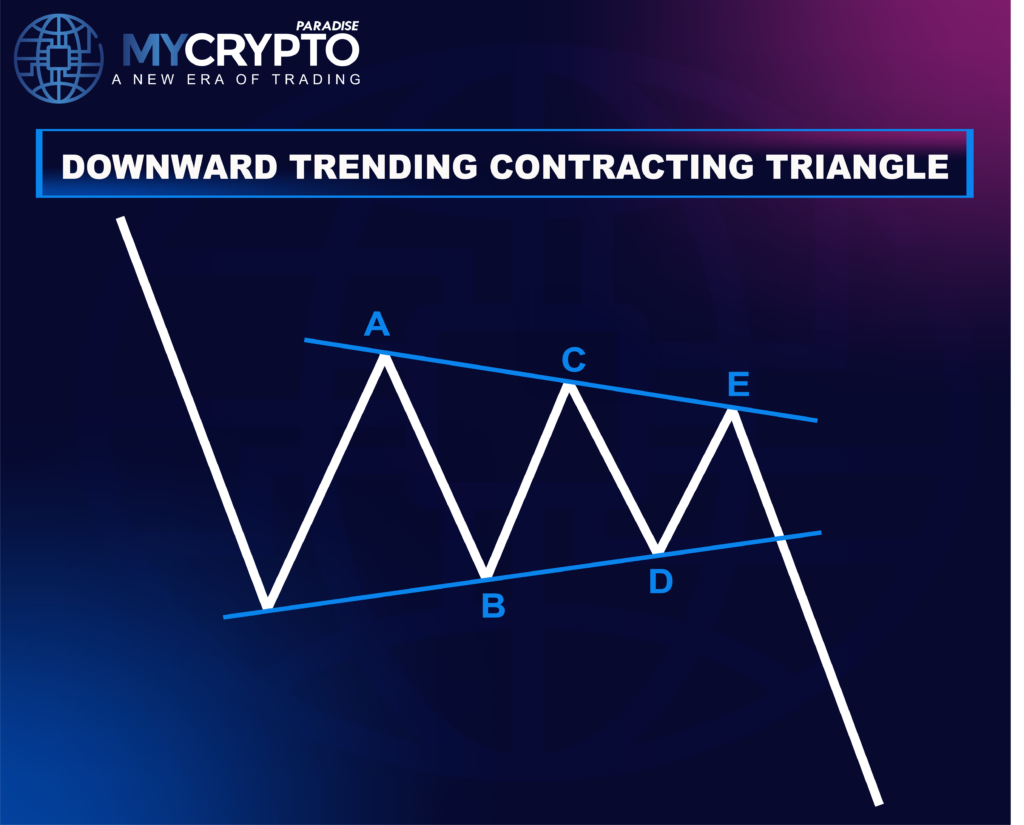
Rules of Bearish Contracting Triangle
Let’s explore the structure of a Bearish Contracting Triangle in a concise, rule-based format:
- Five-Wave Structure: The pattern always consists of five corrective sub-waves labeled A-B-C-D-E, forming a bearish contracting triangle.
- Wave B Can Be Lower or Higher than A: Wave B may undercut or stay above wave A, as long as the pattern maintains a contracting shape.
- Wave C is Shorter Than Wave B: Wave C should not drop below the end of wave B, ensuring the structure continues tightening.
- Wave D Retraces Less Than C: Wave D must remain within the limits of wave C, continuing the downward narrowing wedge.
- Wave E is the Final and Shortest: Wave E completes the triangle, typically staying within wave D’s range and signaling an imminent breakout.
By identifying these characteristics, traders can spot bearish contracting triangles early and prepare for potential market reversals.
Guidelines for Contracting Triangle
Contracting Triangles are not fast or deep corrections; they are slow and shallow. Think of them like a spring that’s winding up, getting ready to snap back in the direction of the main trend. Once you know how to spot them, they can give you really clear trade setups with low risk.
Shallow but Long Correction
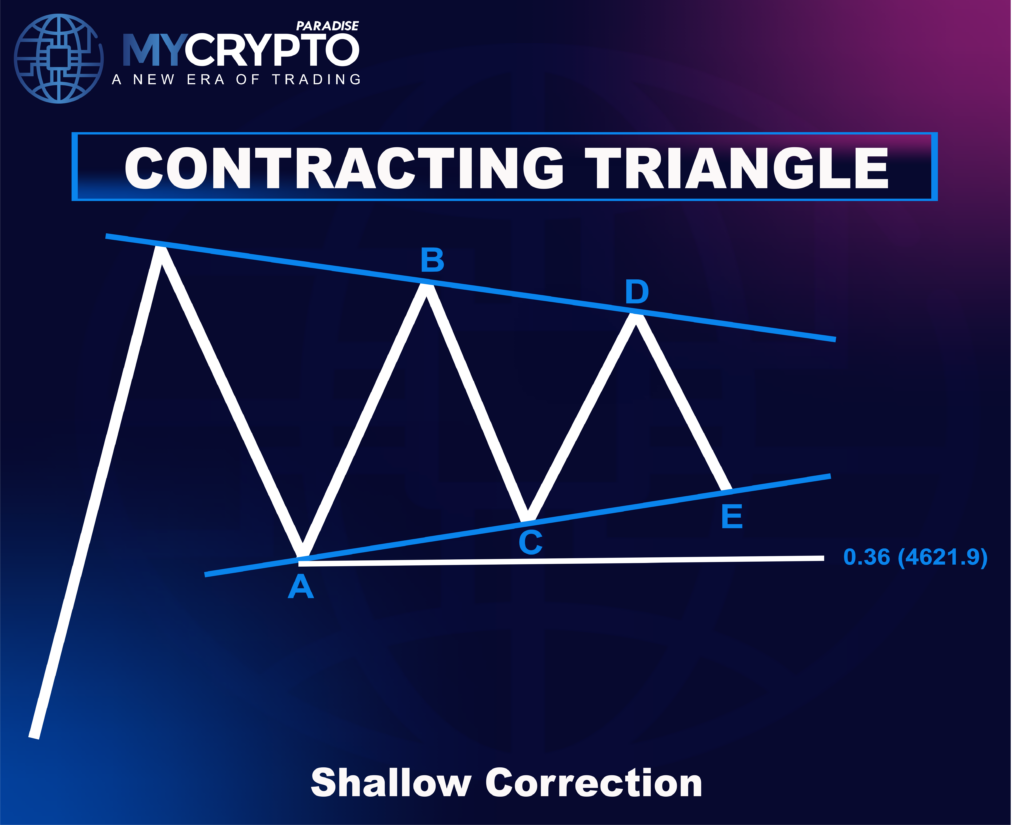
One of the most common traits of a Contracting Triangle is that it doesn’t go deep into the previous trend. Most of the time, it’s a shallow correction, meaning the price doesn’t retrace much. Visually, this makes the pattern look more sideways and tight compared to deeper patterns like Zigzags or Flats.
But what it lacks in depth, it makes up for in time. The Contracting Triangle is a slow-moving structure. It stretches out, often taking up a lot of time to complete. That’s why it can feel boring or choppy while it’s forming.
This mix of shallow retracement and extended duration is a strong clue that the market is simply taking a break and that a Contracting Triangle is in play.
Generating Lines
An easy and effective way to identify a contracting triangle is by drawing two converging lines, one across the highs and one across the lows.
- The top line is drawn through the tops of waves B and D.
- The bottom line is drawn through the bottoms of waves A and C.
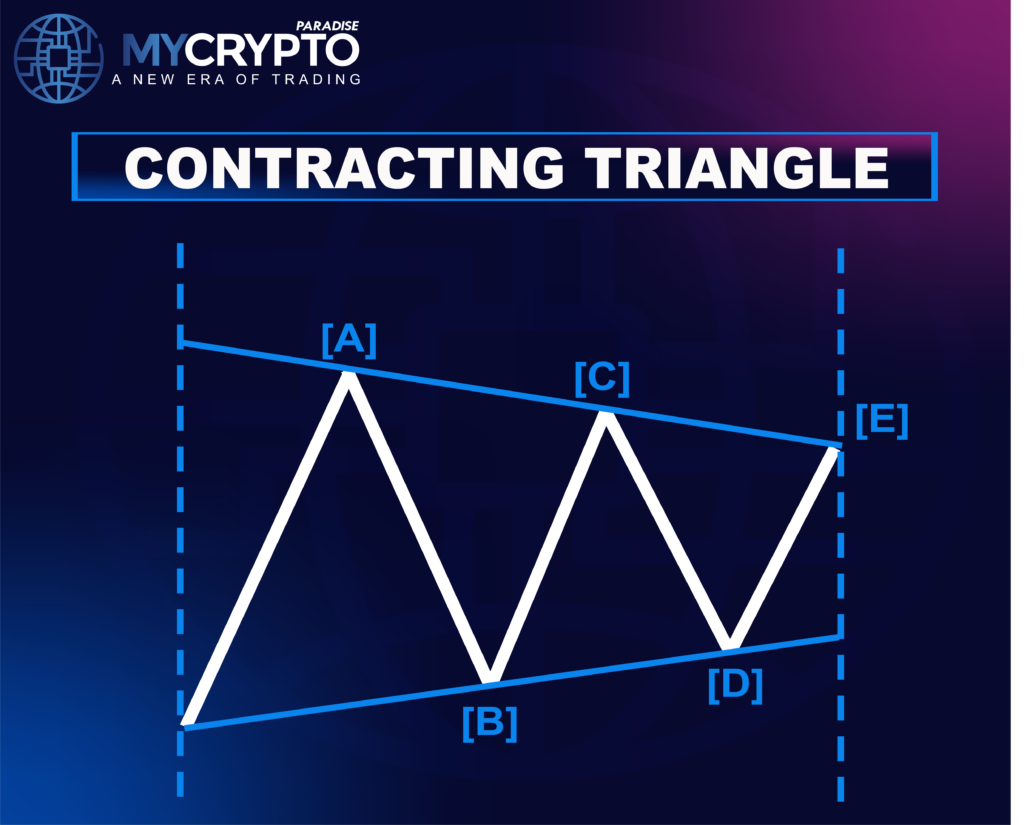
These lines form the triangle’s upper and lower boundaries. To better frame the pattern, it also helps to draw a vertical line at the start and a vertical line at the end of the triangle. This shows where the triangle begins and ends in time.
As the pattern forms, each swing high is lower than the last, and each swing low is higher. The result is a clear, contracting shape. These generating lines make the triangle easier to see and confirm.
How to Trade a Contracting Triangle Correction
Contracting triangles might look challenging to trade, but they are one of the most structured and predictive corrective patterns in Elliott Wave Theory. Learning how to trade them properly can give you a strong edge.
But having an edge isn’t enough if you’re missing a complete strategy. At ParadiseFamilyVIP 🎖️, we turn structured patterns like contracting triangles into real trading opportunities by combining adaptive tactics, professional money management, and constant market monitoring. We share clearly defined entry and exit levels so you don’t just recognize patterns—you trade them like a PRO.
Let’s go through the process step-by-step:
Recognize the Pattern Early
Before you can trade it, you have to spot it early. A contracting triangle always unfolds in five waves labeled A-B-C-D-E, all of which are corrective. The key is the converging shape: each wave is smaller than the last, and together they form a wedge.
Here’s what to look for:
- Wave A starts the correction, and Wave B should not go beyond its start.
- Waves C and D stay within the boundaries defined by A and B.
- You can draw two lines: one from the highs of waves A and C, and another from the lows of waves B and D. These lines should move toward each other.
- The pattern typically appears in Wave 4 of an impulse, Wave B of a zigzag, or the final leg of a complex correction.
Recognizing this setup early helps you avoid mistaking the sideways grind for a deeper reversal and lets you prepare for the breakout move ahead.
Entry Strategy
The optimal entry point occurs after Wave E completes, marking the end of the contracting triangle. Since Wave E is usually the shortest and final leg, it often hints at an imminent breakout. Look for price exhaustion signals such as reversal candlestick patterns, momentum divergence on indicators like RSI or MACD, around the shallow retracement zone of the 36% Fibonacci level.
Exit Strategy
Target the breakout move following Wave E, aiming for nearby resistance zones or Fibonacci extensions like the 1.618 level. Price often accelerates sharply out of the triangle in the same direction before the appearance of the triangle.
Follow the Guidelines
The following are the important guidelines:
- Shallow Correction (36%): Contracting triangles often retrace only modestly into the previous trend, typically ending around the 36% Fibonacci level. They represent a pause rather than a reversal, and price rarely dives deep into prior territory.
- Long Duration: This pattern is more about time than price. Triangles can take a long time to complete, sometimes appearing in Wave 4 or Wave B scenarios.
- Converging Structure: Contracting triangles squeeze between two trendlines that gradually converge. If you connect the highs of Waves A and C, and the lows of Waves B and D, the lines should slope toward each other. This helps validate the triangle and gives you clear levels to anticipate the breakout.
If you’re unsure whether you’re looking at a contracting triangle, remember this: when the market is moving sideways for a prolonged time, price action becomes tighter with each swing, and the retracement is shallow, it’s often a triangle taking shape.
FAQs
What is a Contracting Triangle in Elliott Wave Theory?
A Contracting Triangle in Elliott Wave Theory is a five-wave corrective pattern labeled A–B–C–D–E, where price movement narrows over time. It usually forms between converging trendlines and represents a pause in the trend, not a reversal.
Where does a Contracting Triangle most commonly appear?
A Contracting Triangle most commonly appears in Wave 4 of an impulse or Wave B of an A-B-C correction. These are areas where the market is preparing for a final move in the direction of the larger trend.
What makes a Contracting Triangle different from other corrections like Zigzags or Flats?
A Contracting Triangle stands out for its sideways, time-consuming nature and narrowing price range. Unlike Zigzags or Flats that often show deeper, more aggressive retracements, Contracting Triangles tend to retrace only shallowly, usually around the 36% Fibonacci level, and gradually tighten with each wave. This pattern signals market consolidation, not reversal, making it a strong setup for trend continuation traders.
Can I trade inside a Contracting Triangle pattern?
While trading inside a Contracting Triangle is risky due to the choppy and tightening price action, it’s safer to wait for Wave E to complete and then trade the breakout in the direction of the larger trend.
What’s the biggest mistake traders make with Contracting Triangles?
The biggest mistake traders make with Contracting Triangles is assuming the breakout will happen early. Because the pattern is time-consuming and deceptive, jumping in too soon before Wave E ends can lead to premature trades or false breakouts.
Conclusion
Now that you understand how to identify and trade Contracting Triangle corrections, you’re better prepared to navigate sideways markets with precision and patience. Recognizing this time-consuming yet shallow correction, especially in Wave 4 or B wave scenarios, can give you a powerful edge, allowing you to avoid false reversals and position yourself confidently for the next breakout in the direction of the previous main trend.
But technical analysis alone isn’t enough. True success in crypto trading requires more than just spotting chart patterns; you need a solid strategy, emotional discipline, and consistent access to high-probability trade setups.
That’s exactly what we offer at ParadiseFamilyVIP 🎖️. Our proven approach combines technical analysis, on-chain metrics, market sentiment, and whale behavior to deliver premium crypto signals and portfolio management.
Ready to trade like a PRO?
👉Check availability for ParadiseFamilyVIP 🎖️ (Click it)
If your preferred circle is full, join the waiting list to reserve your spot. Just starting? No problem, our FREE Telegram channels are the perfect launchpad for building your capital and stepping up later.